GRAPHIC DESIGN · DATA VISUALIZATION
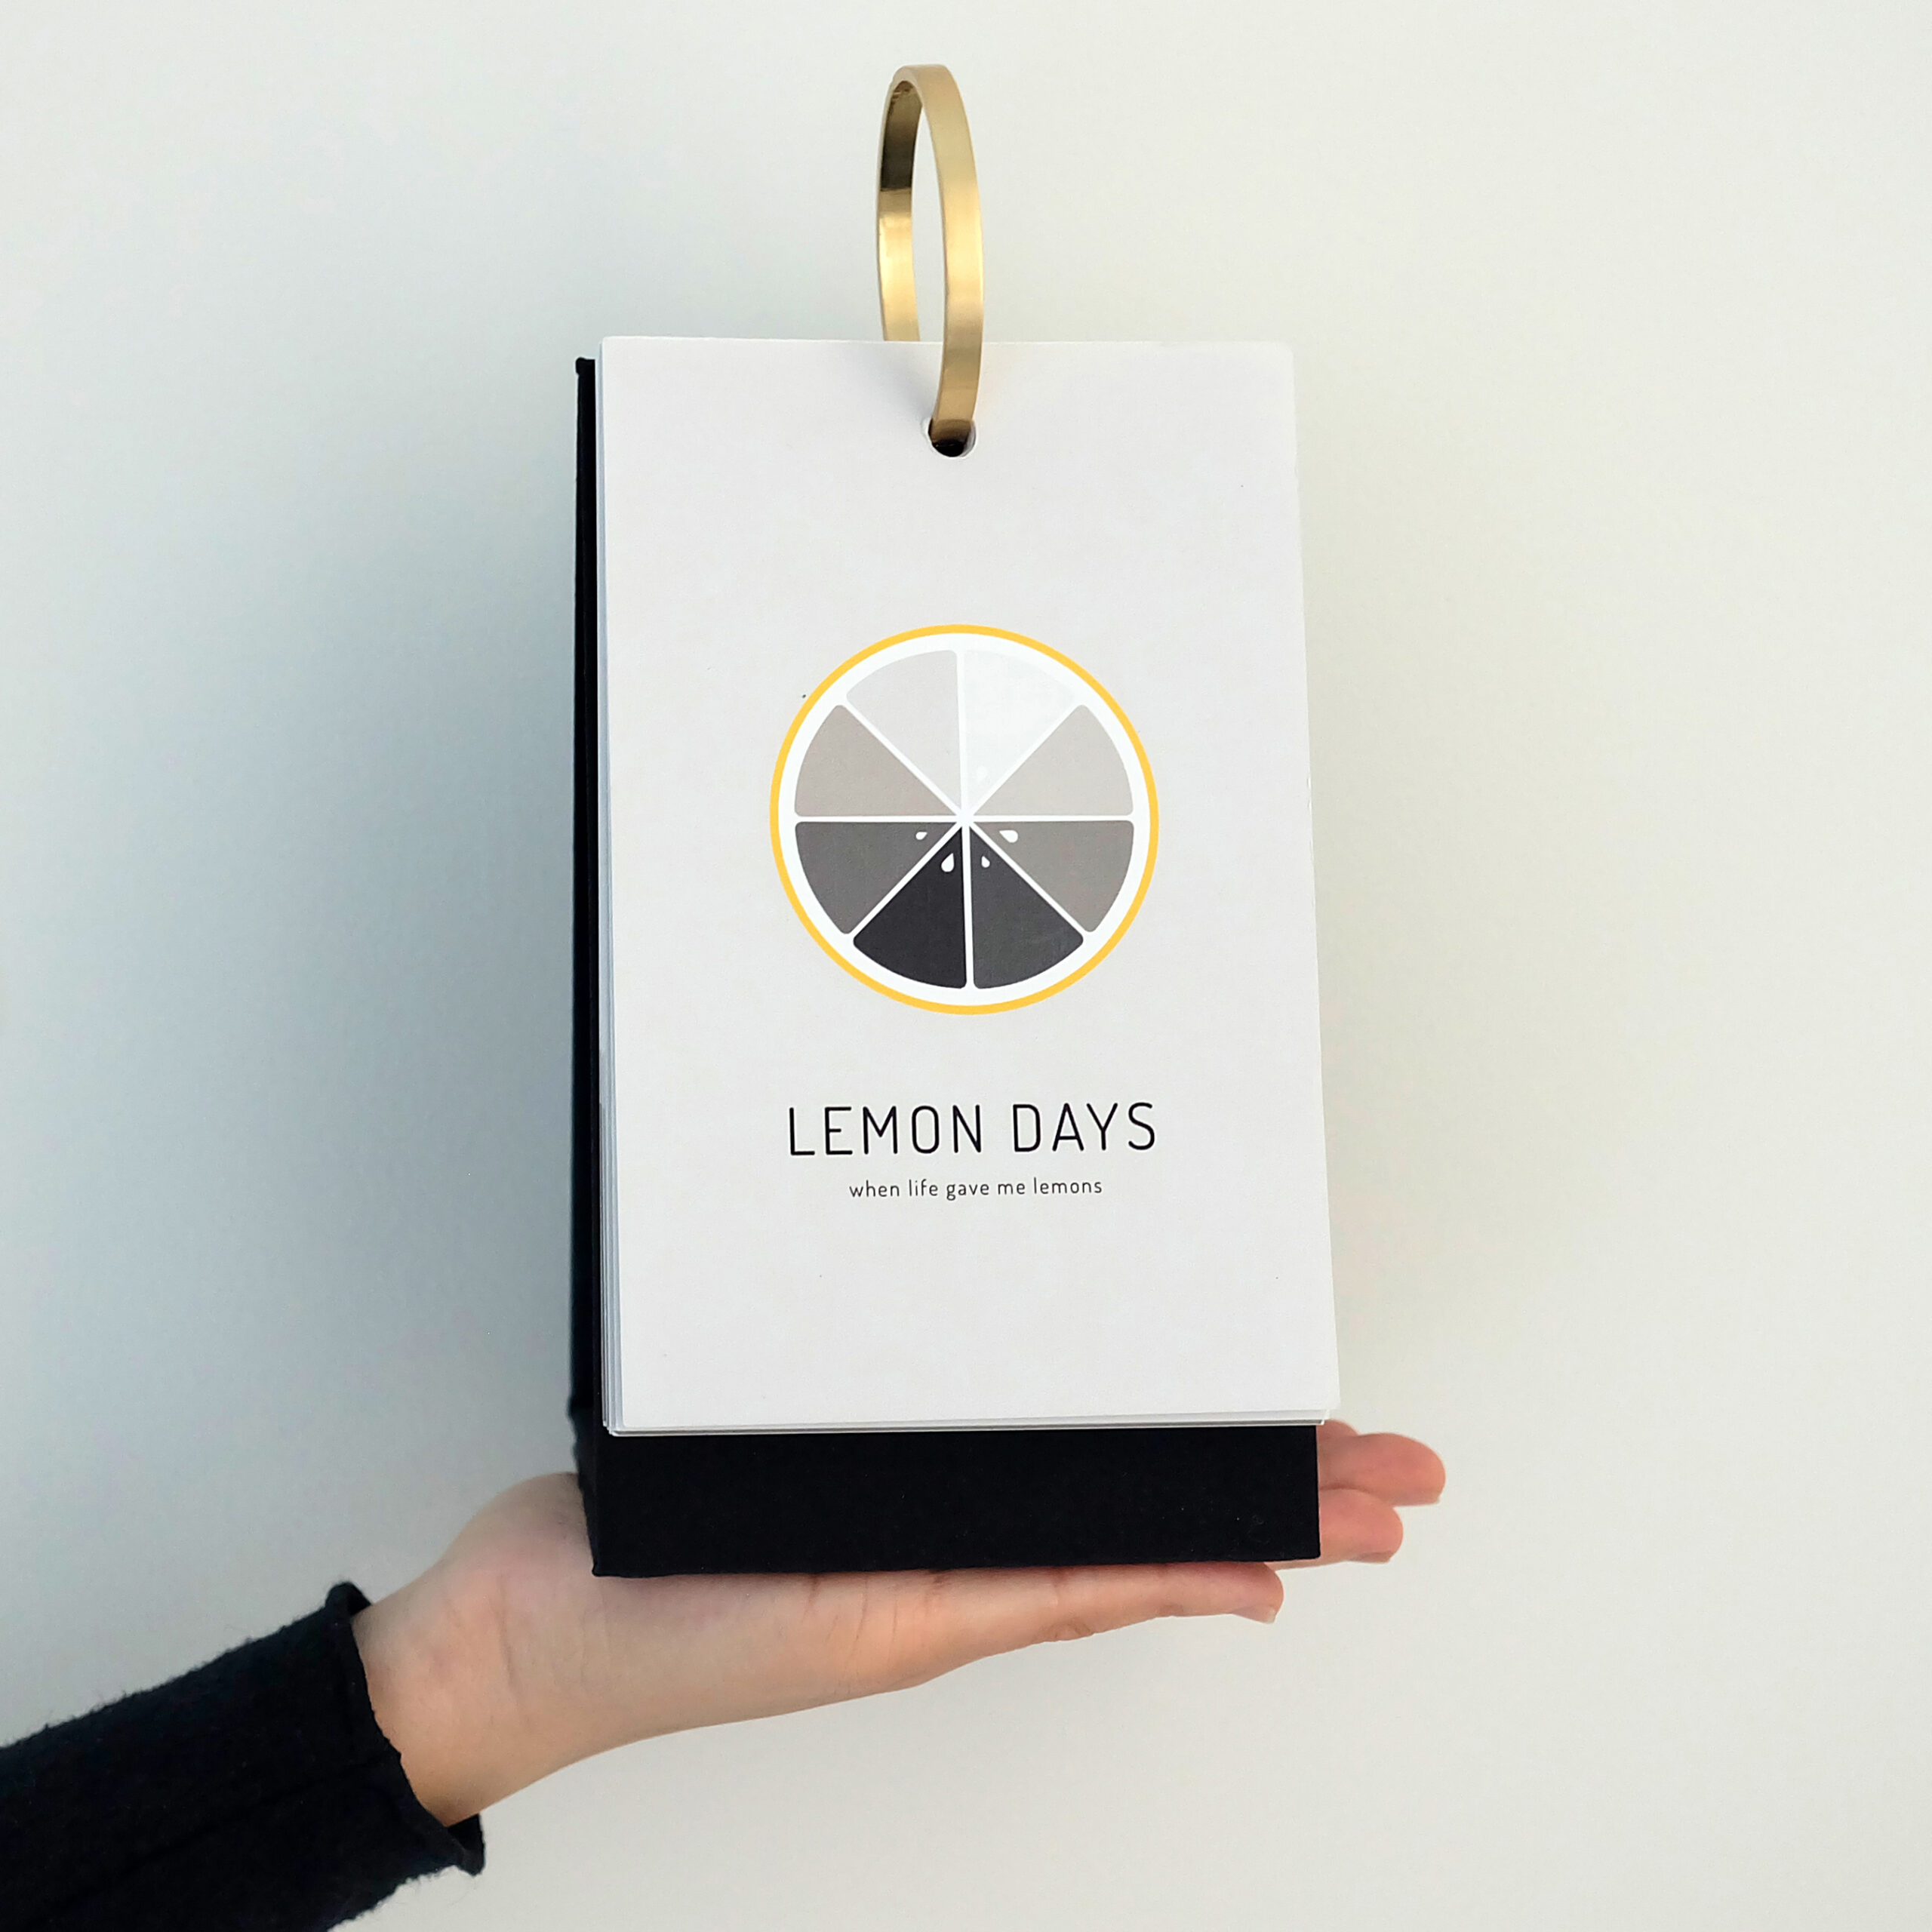
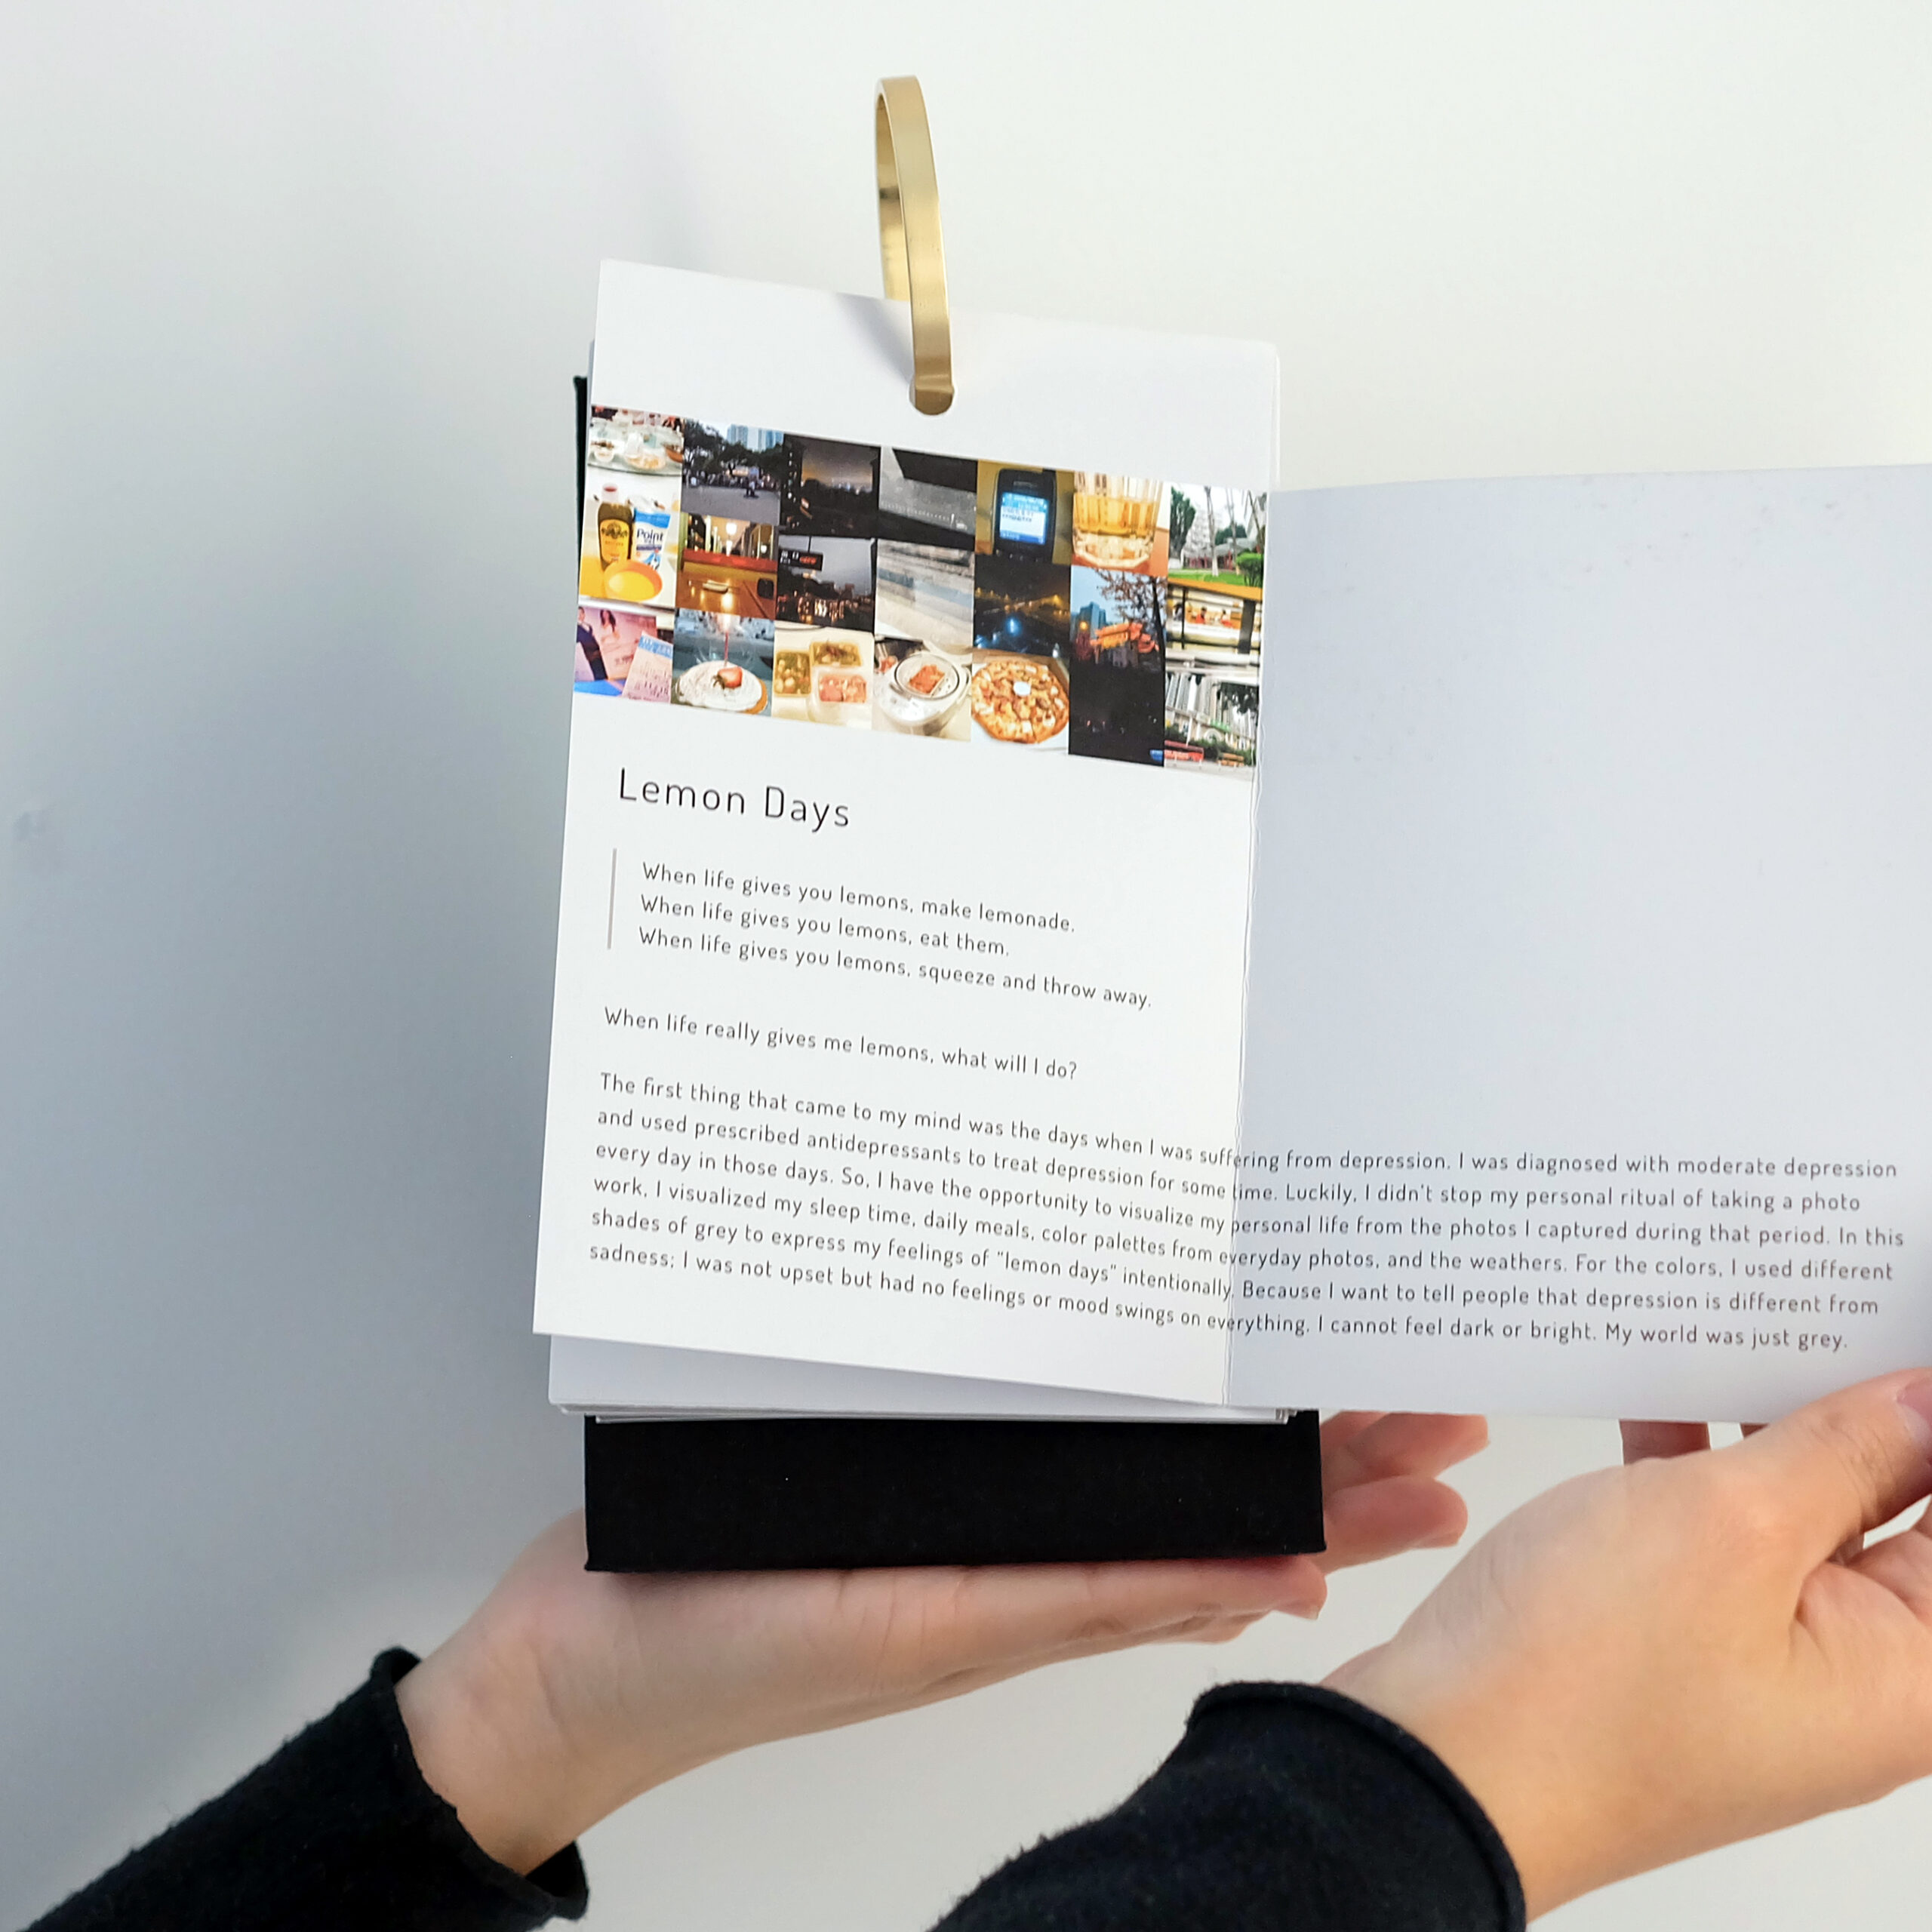
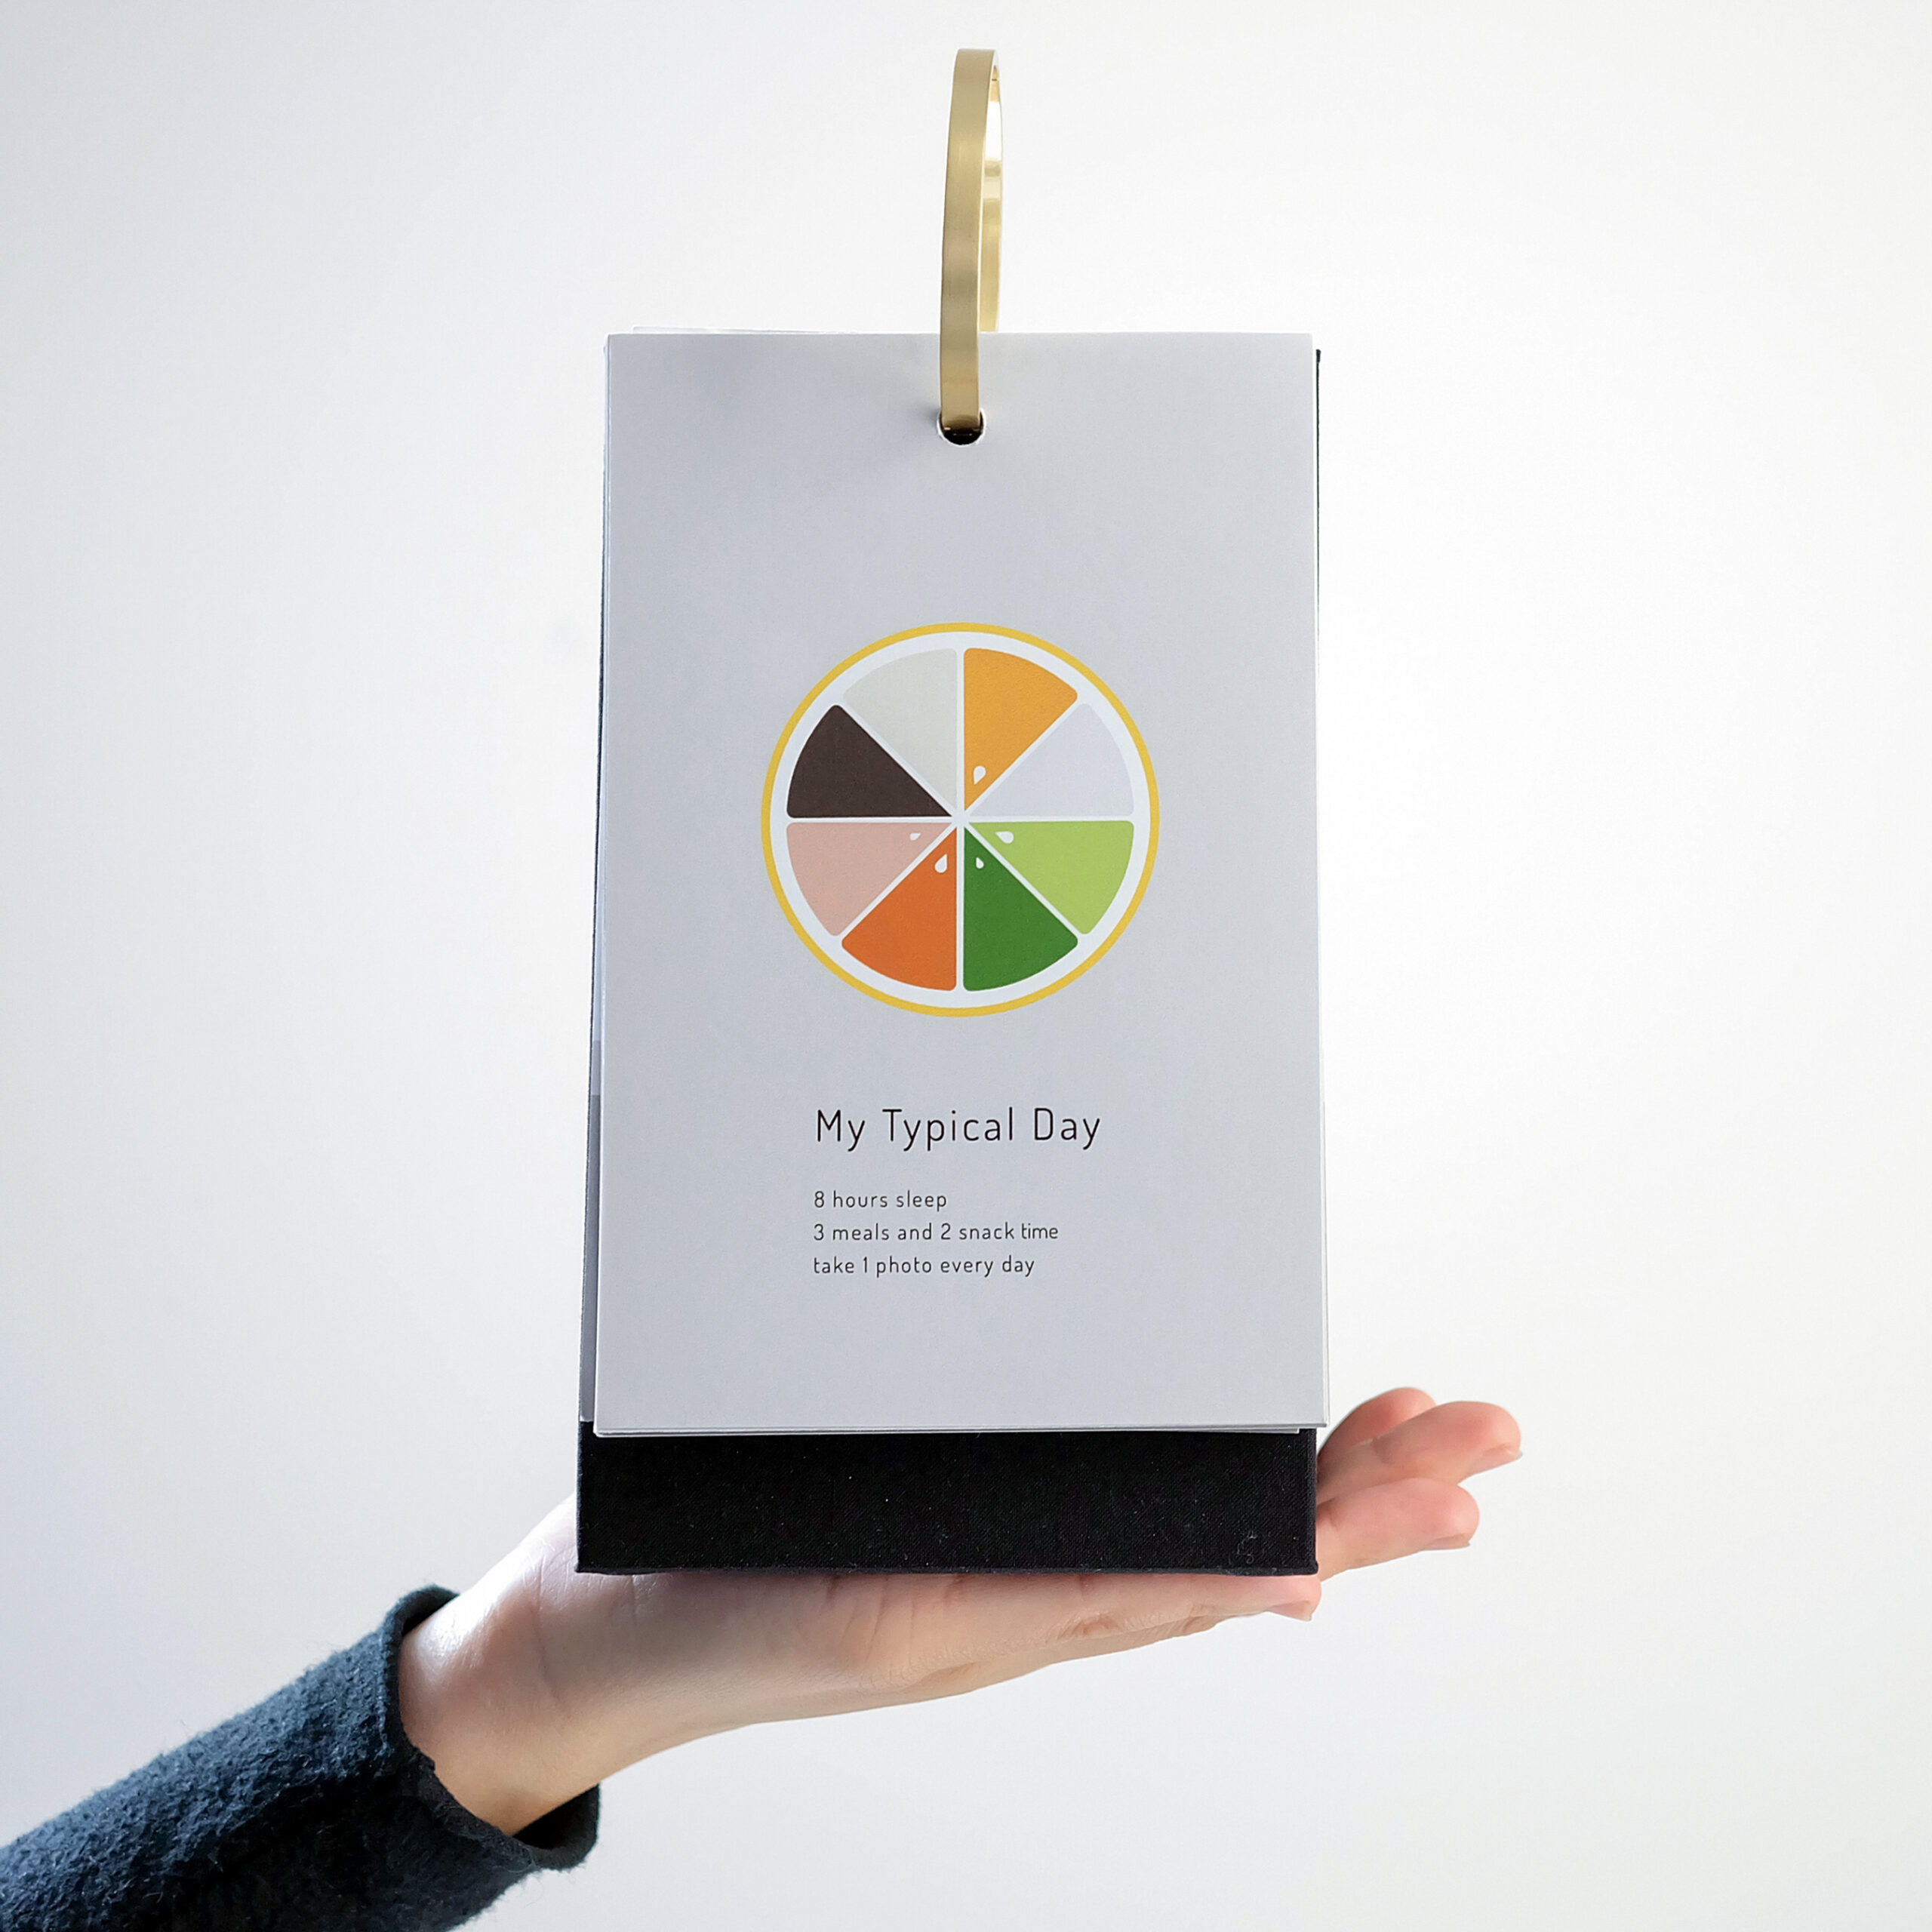
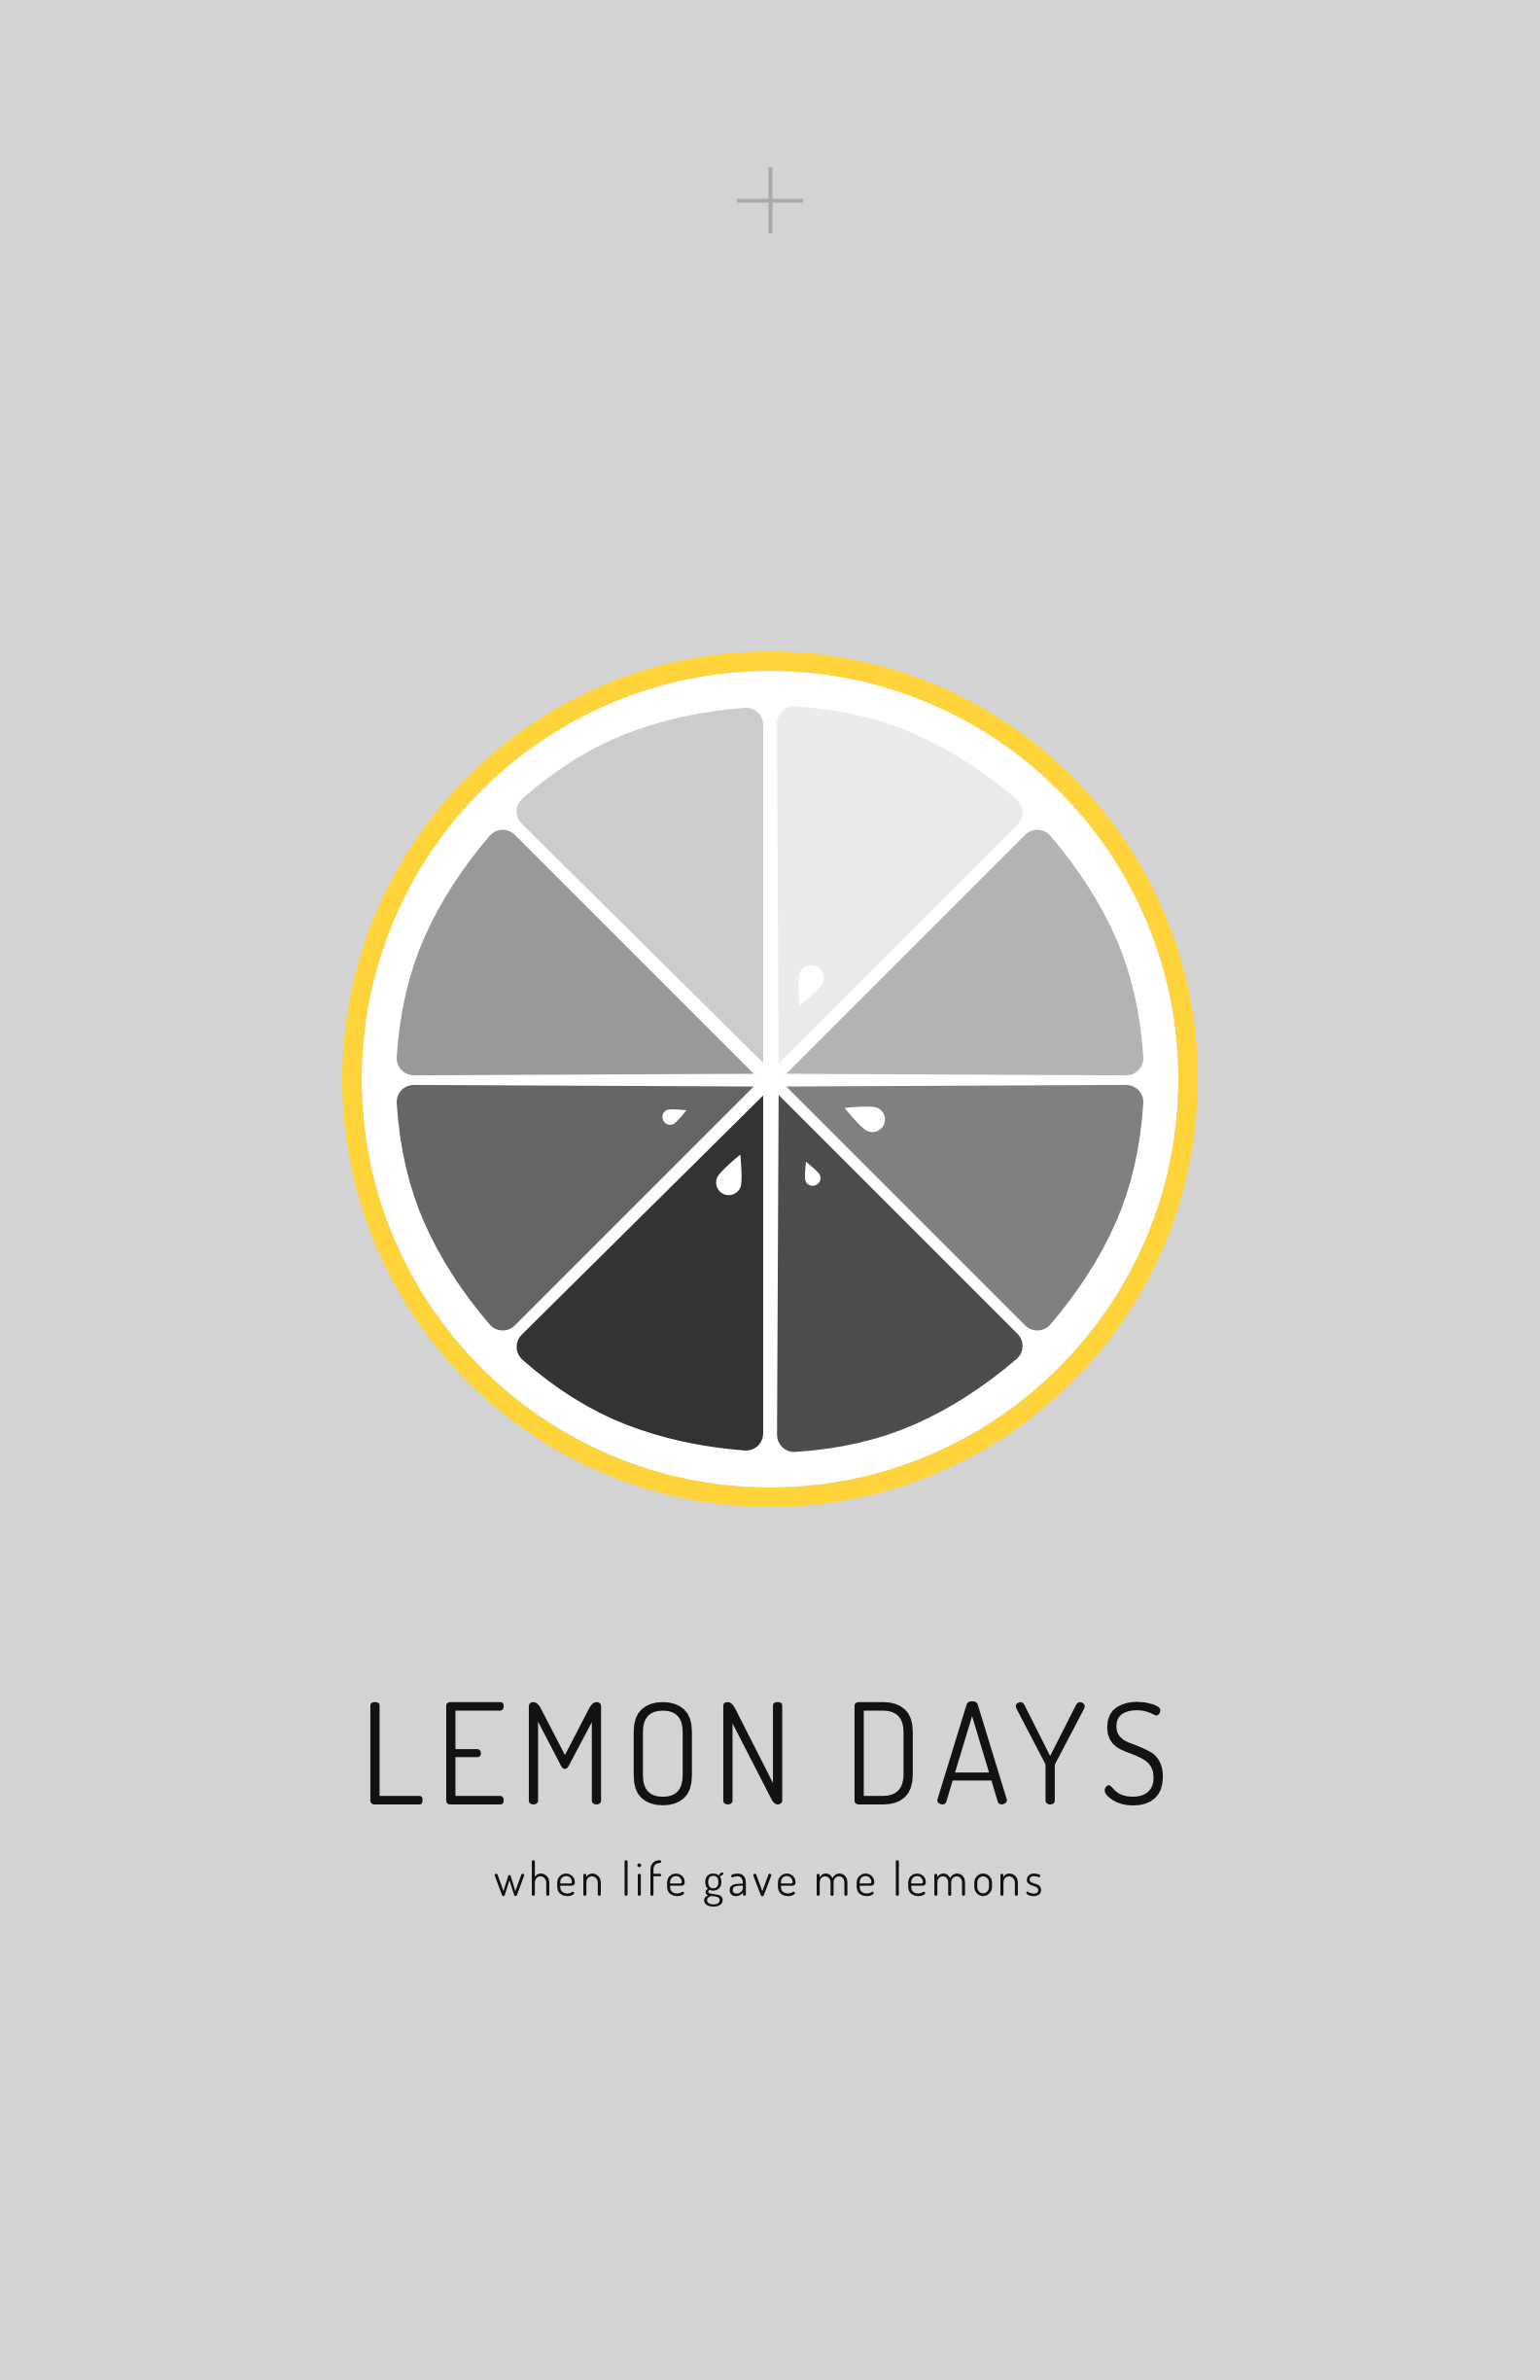
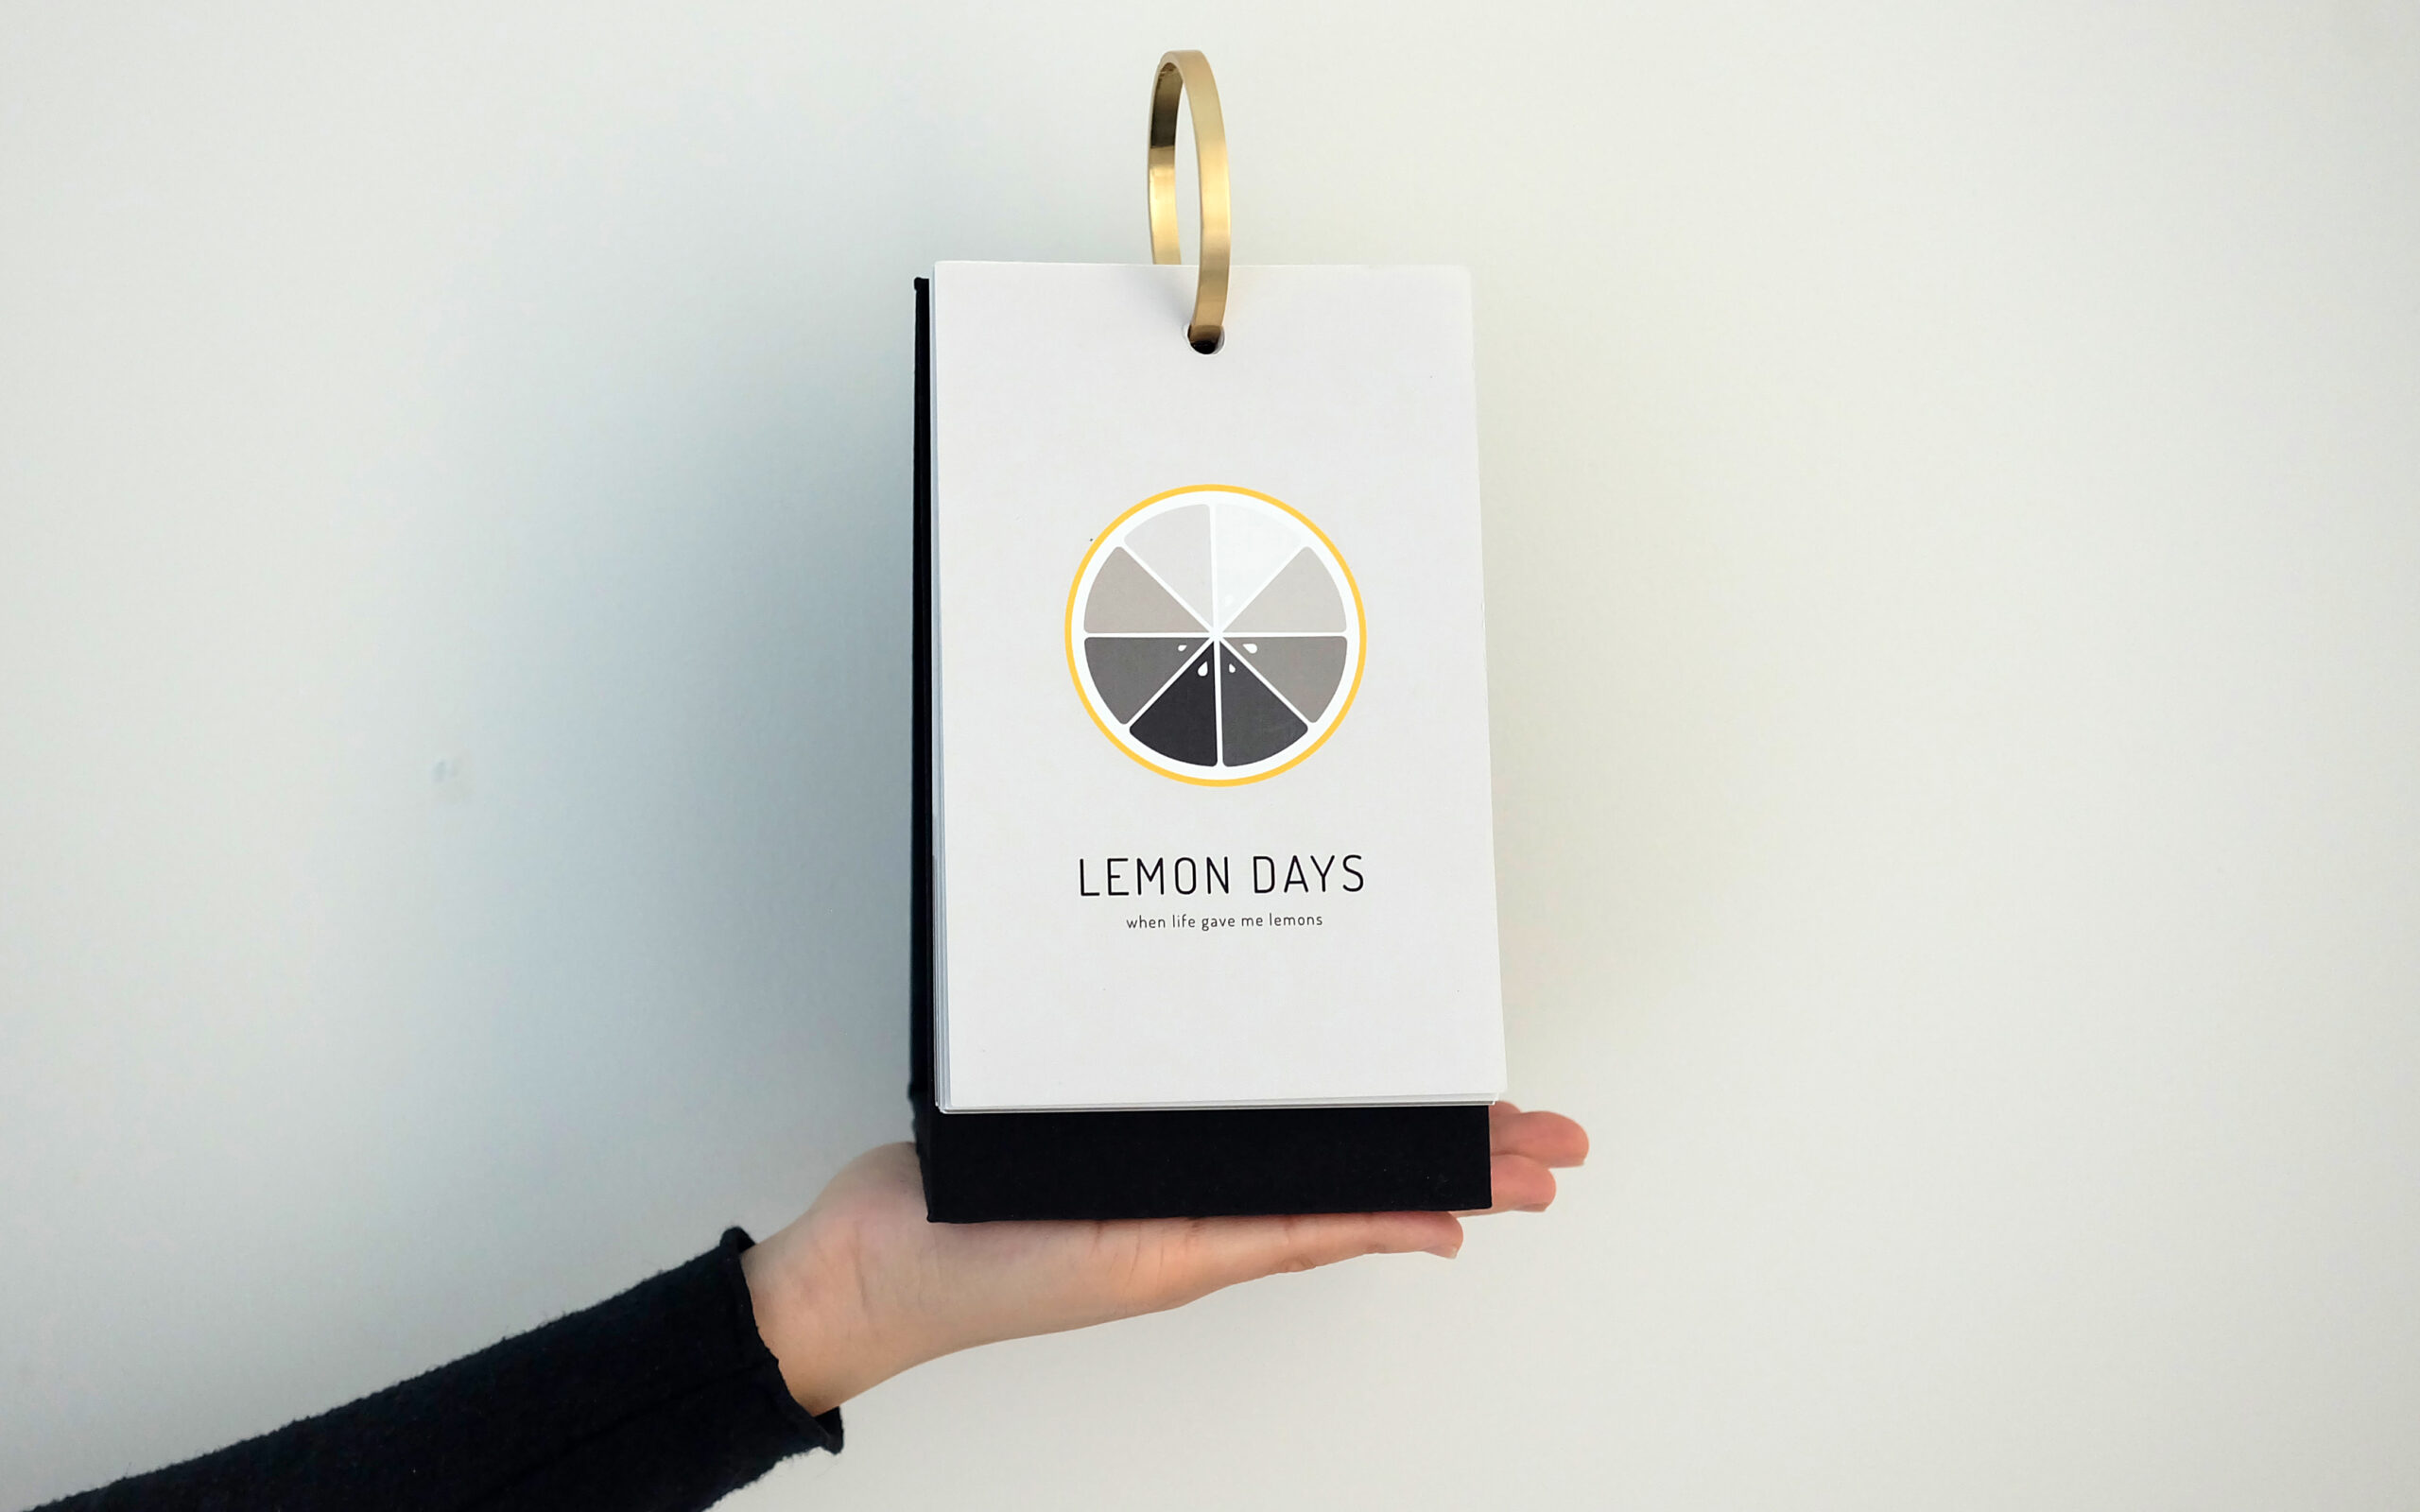
Lemon Days
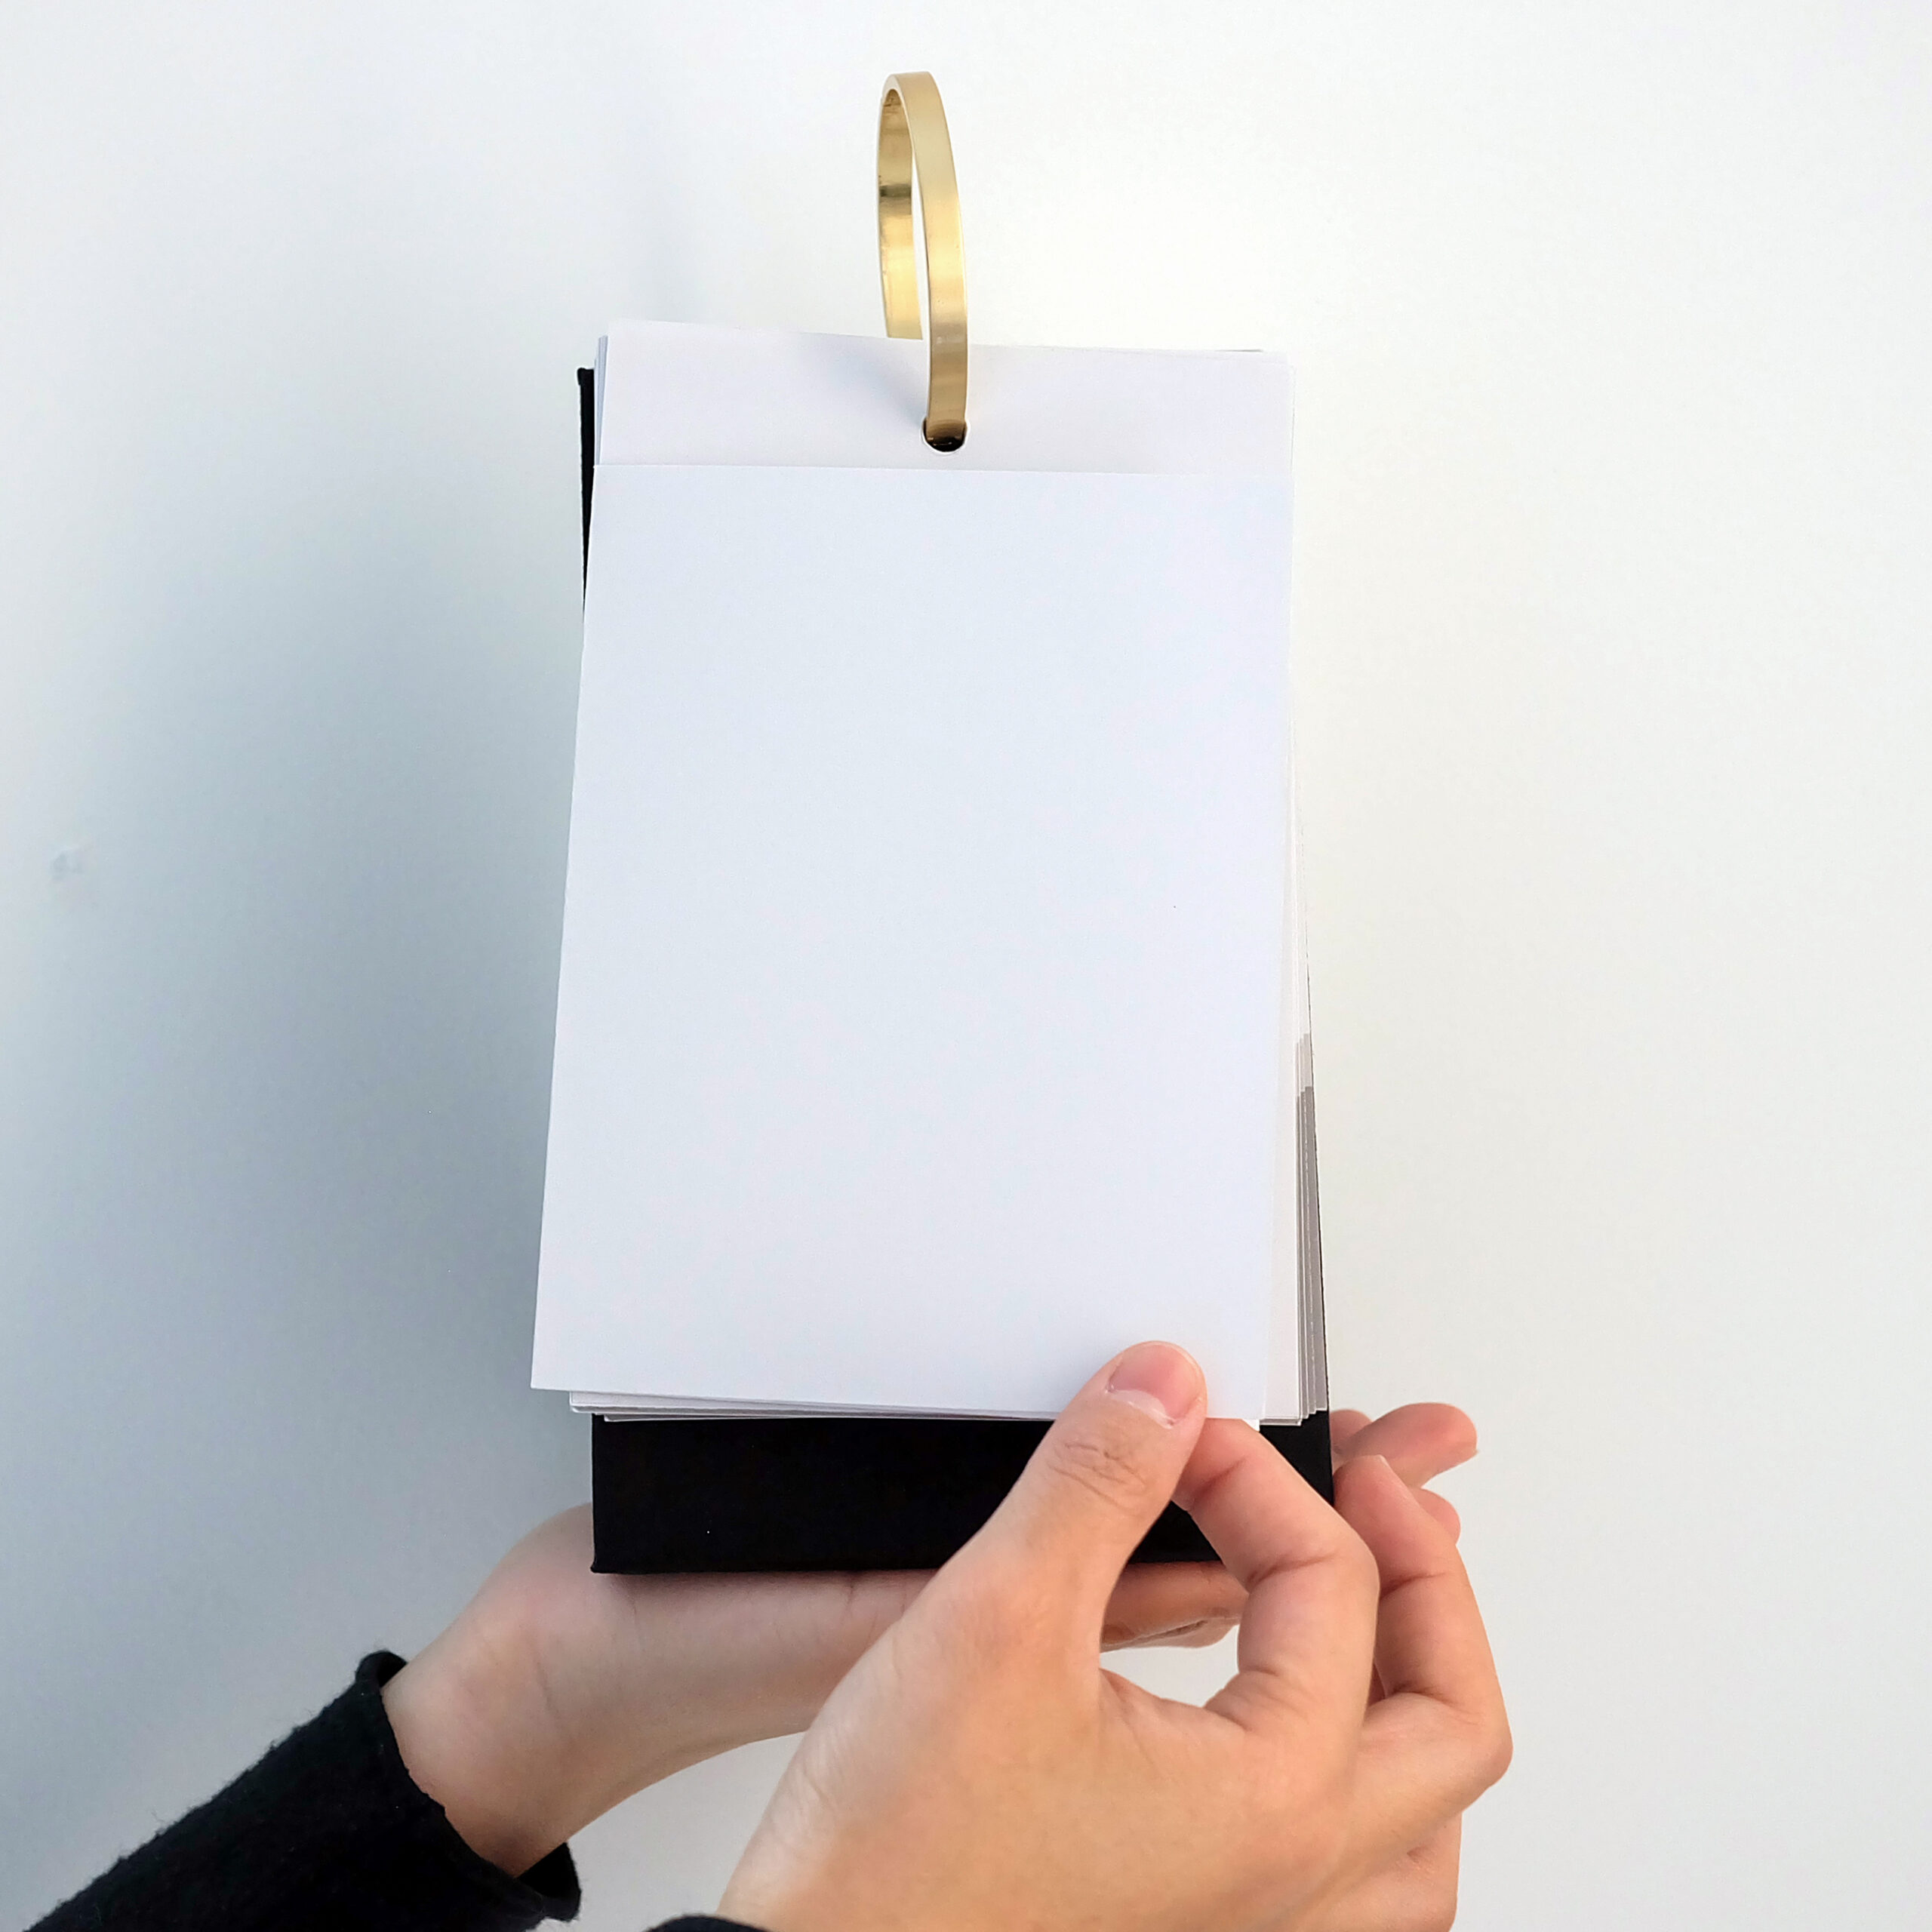
PHYSICAL CALENDAR
A work about data visualization.
A work about self-study.
A work about depression.
OVERVIEW
THE DESIGN
In the thesis year of my MFA program at CCA, I was working in the area of biography. I was given a lemon and asked to design anything with the element of lemon.
📅 TIME
Sep 2019
🛠 TOOLS
Sketch
Printer
✅ MY JOBS
Data Screening
Translation
Data Visualization
Graphic Design
Crafting
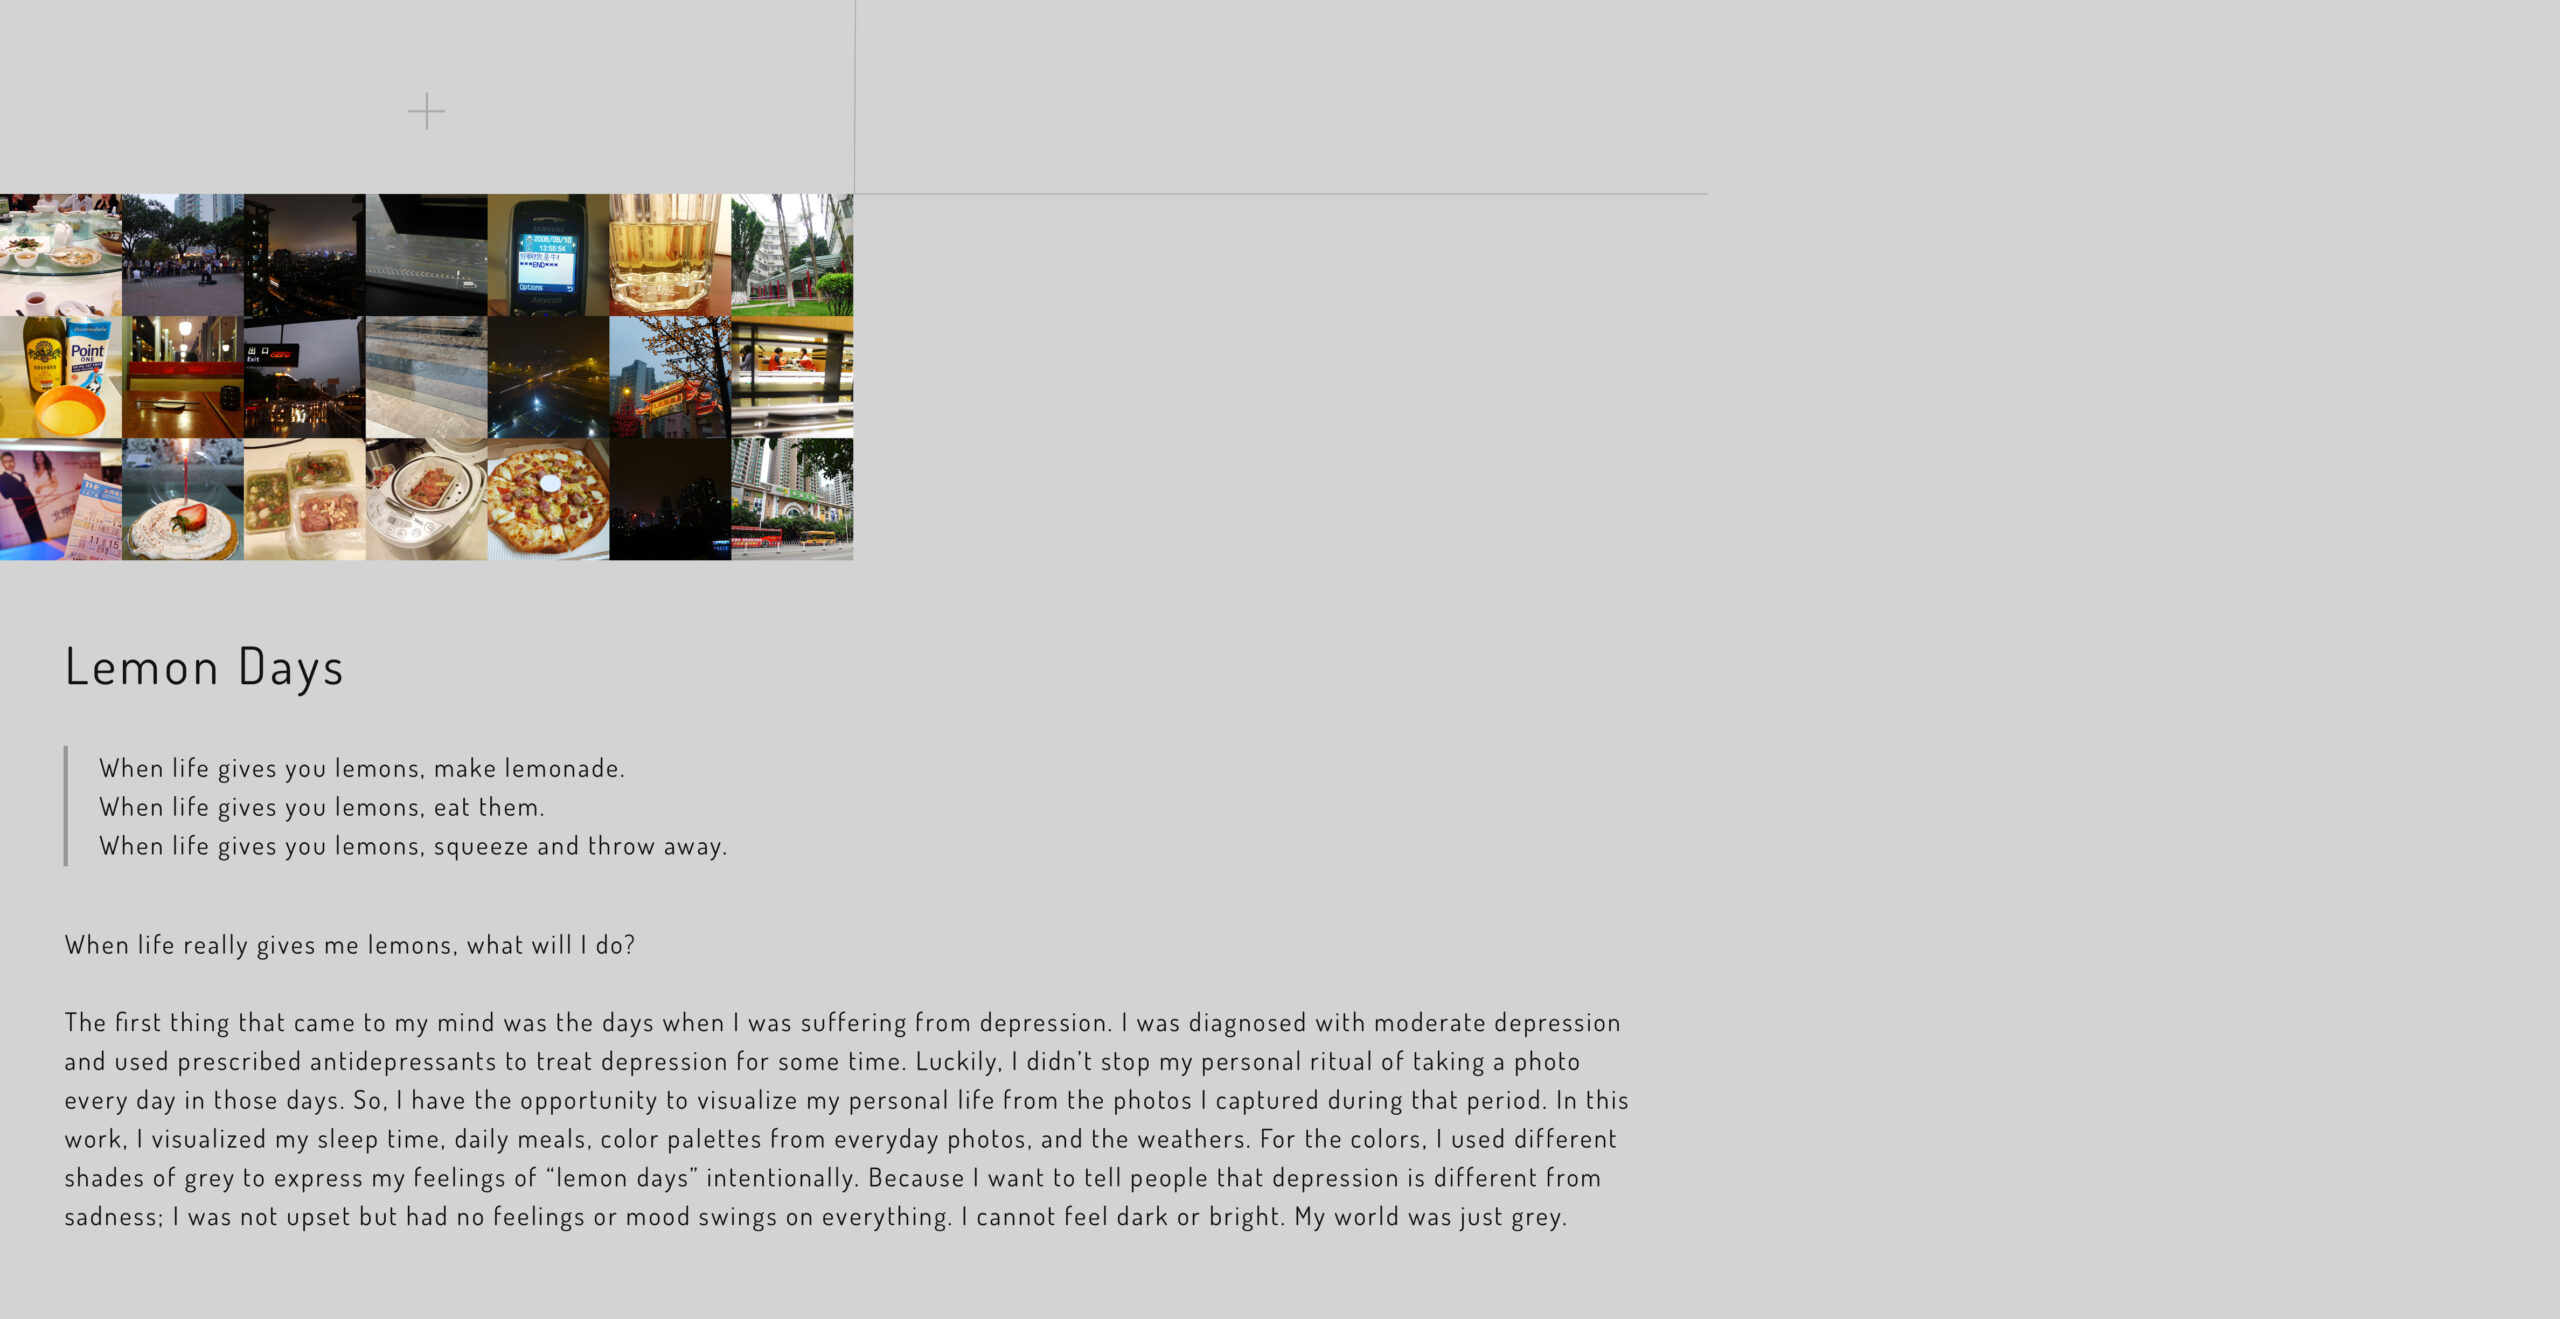
When life gives you lemons
"Make lemonade."
"Eat them."
"Squeeze and throw away."
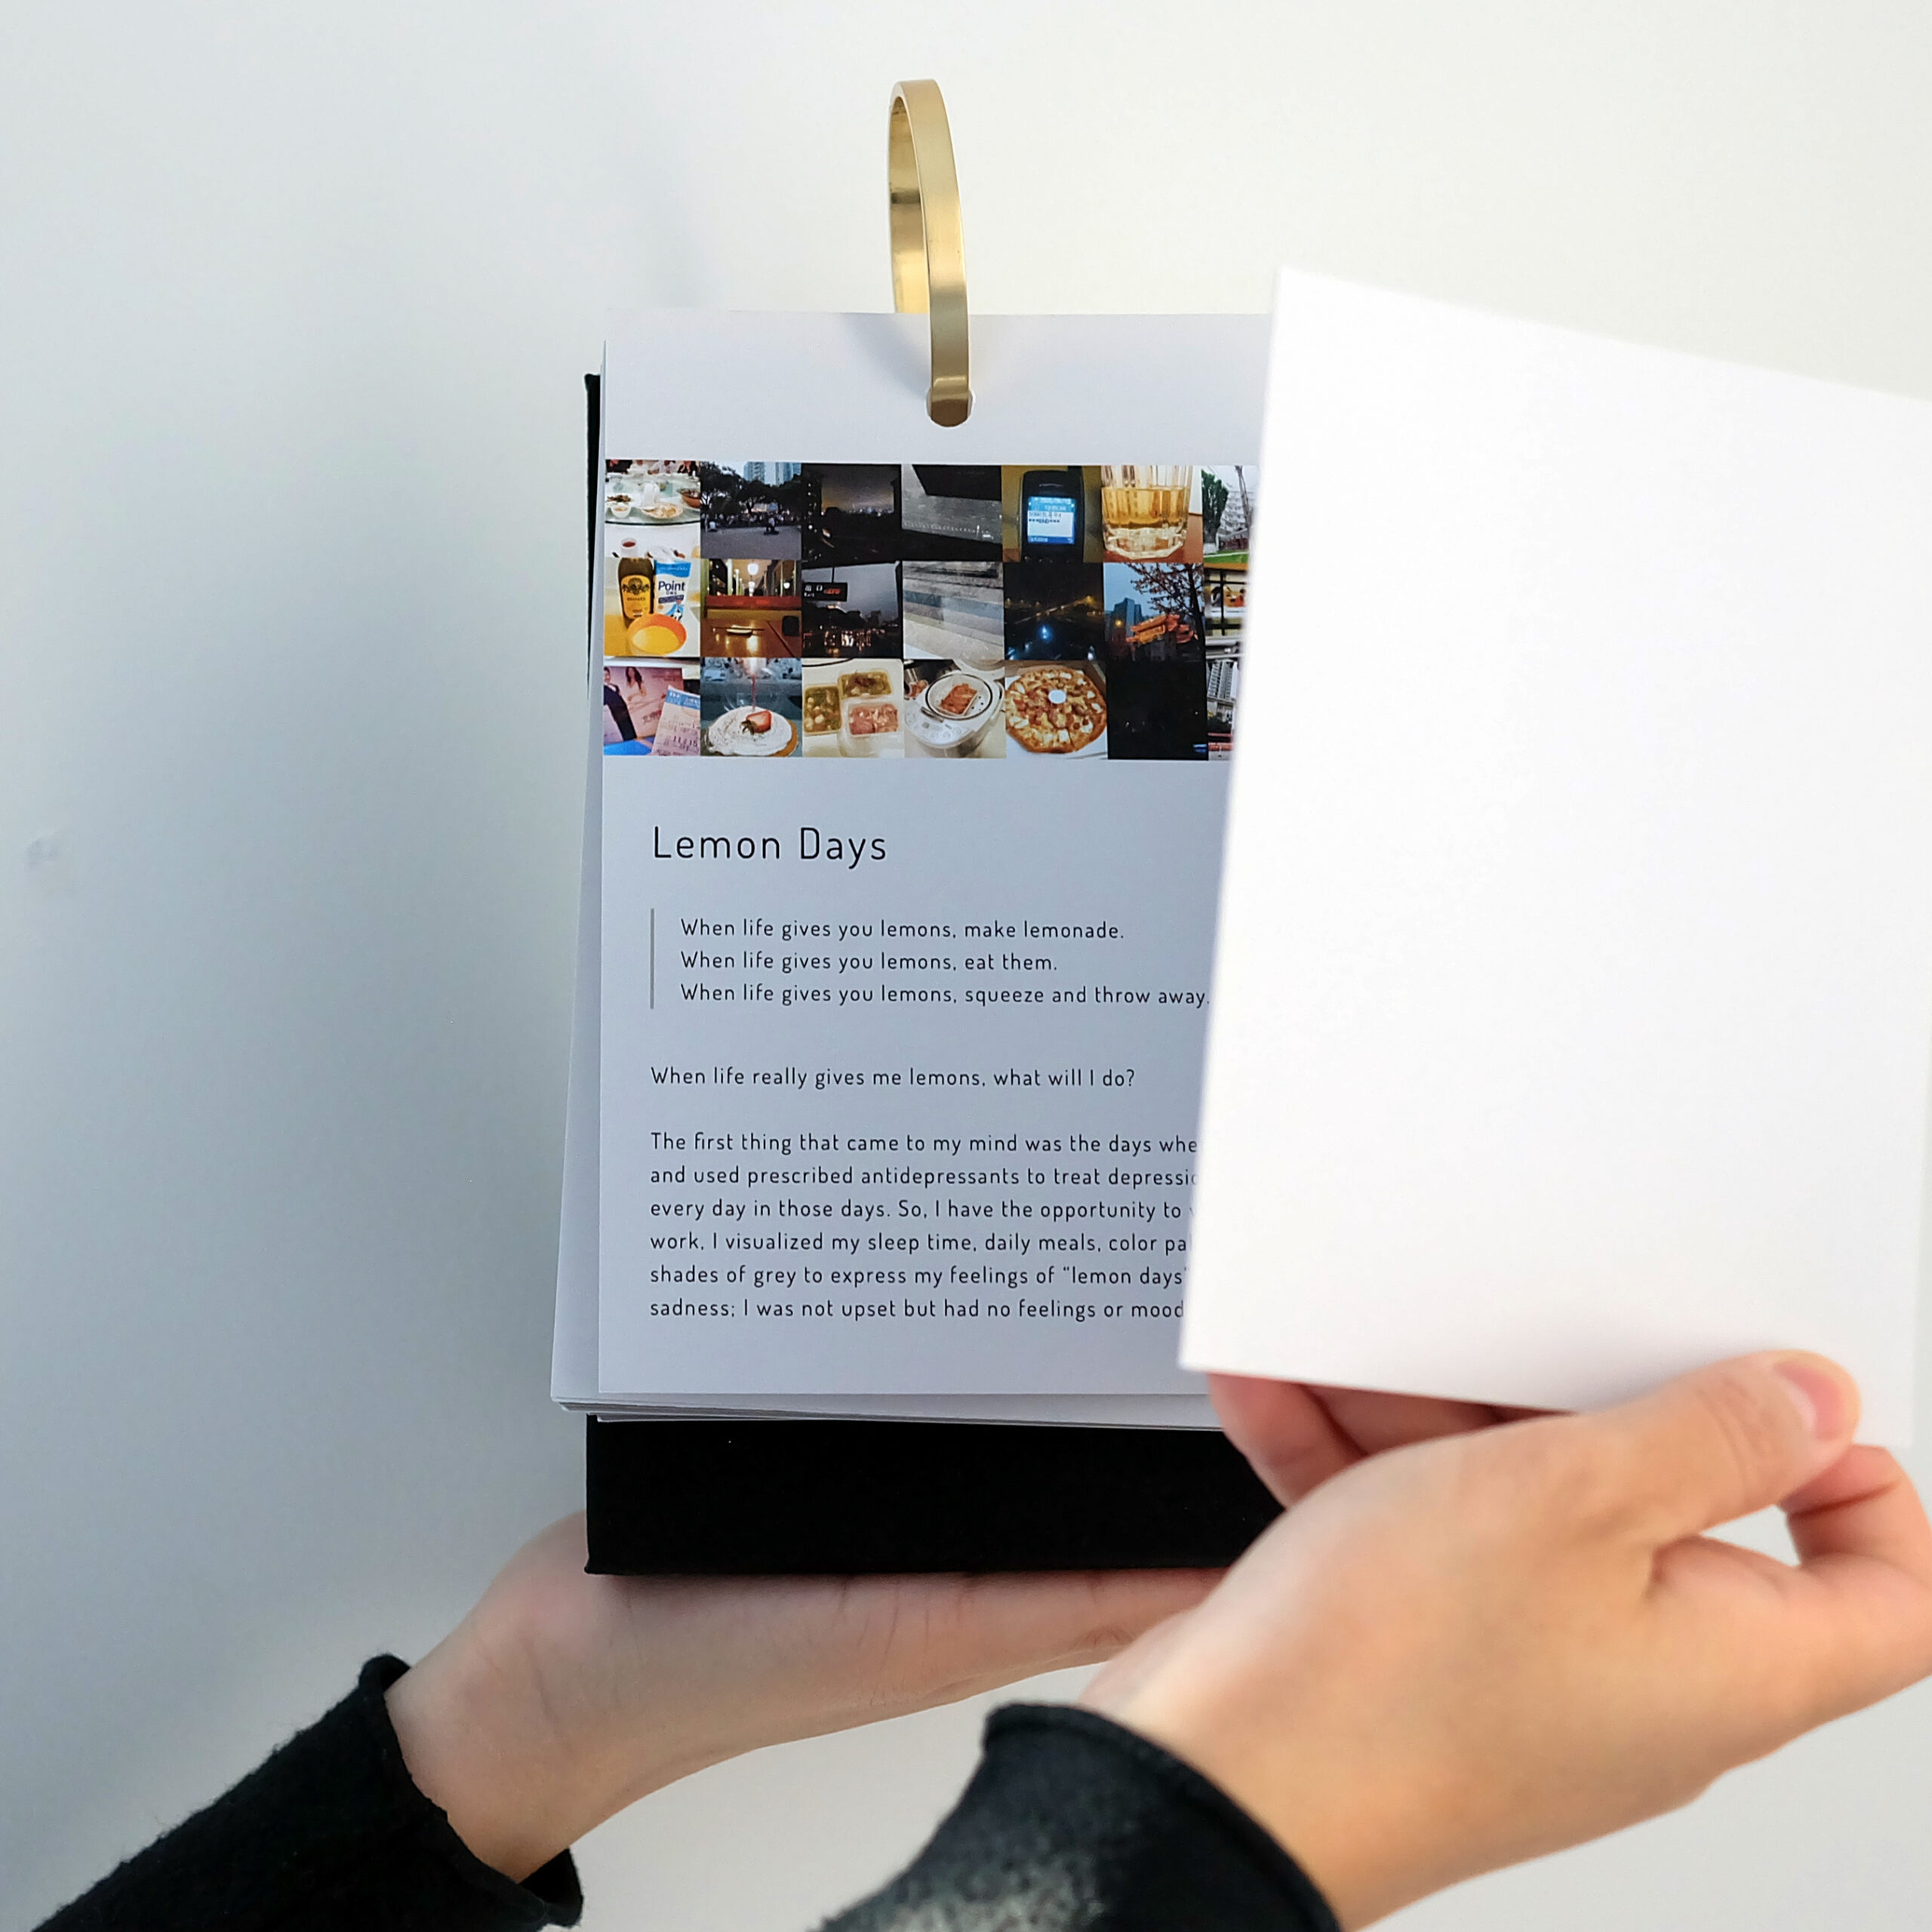
When life gives me lemons, what will I do?
The first thing that came to my mind was the days when I was suffering from depression.
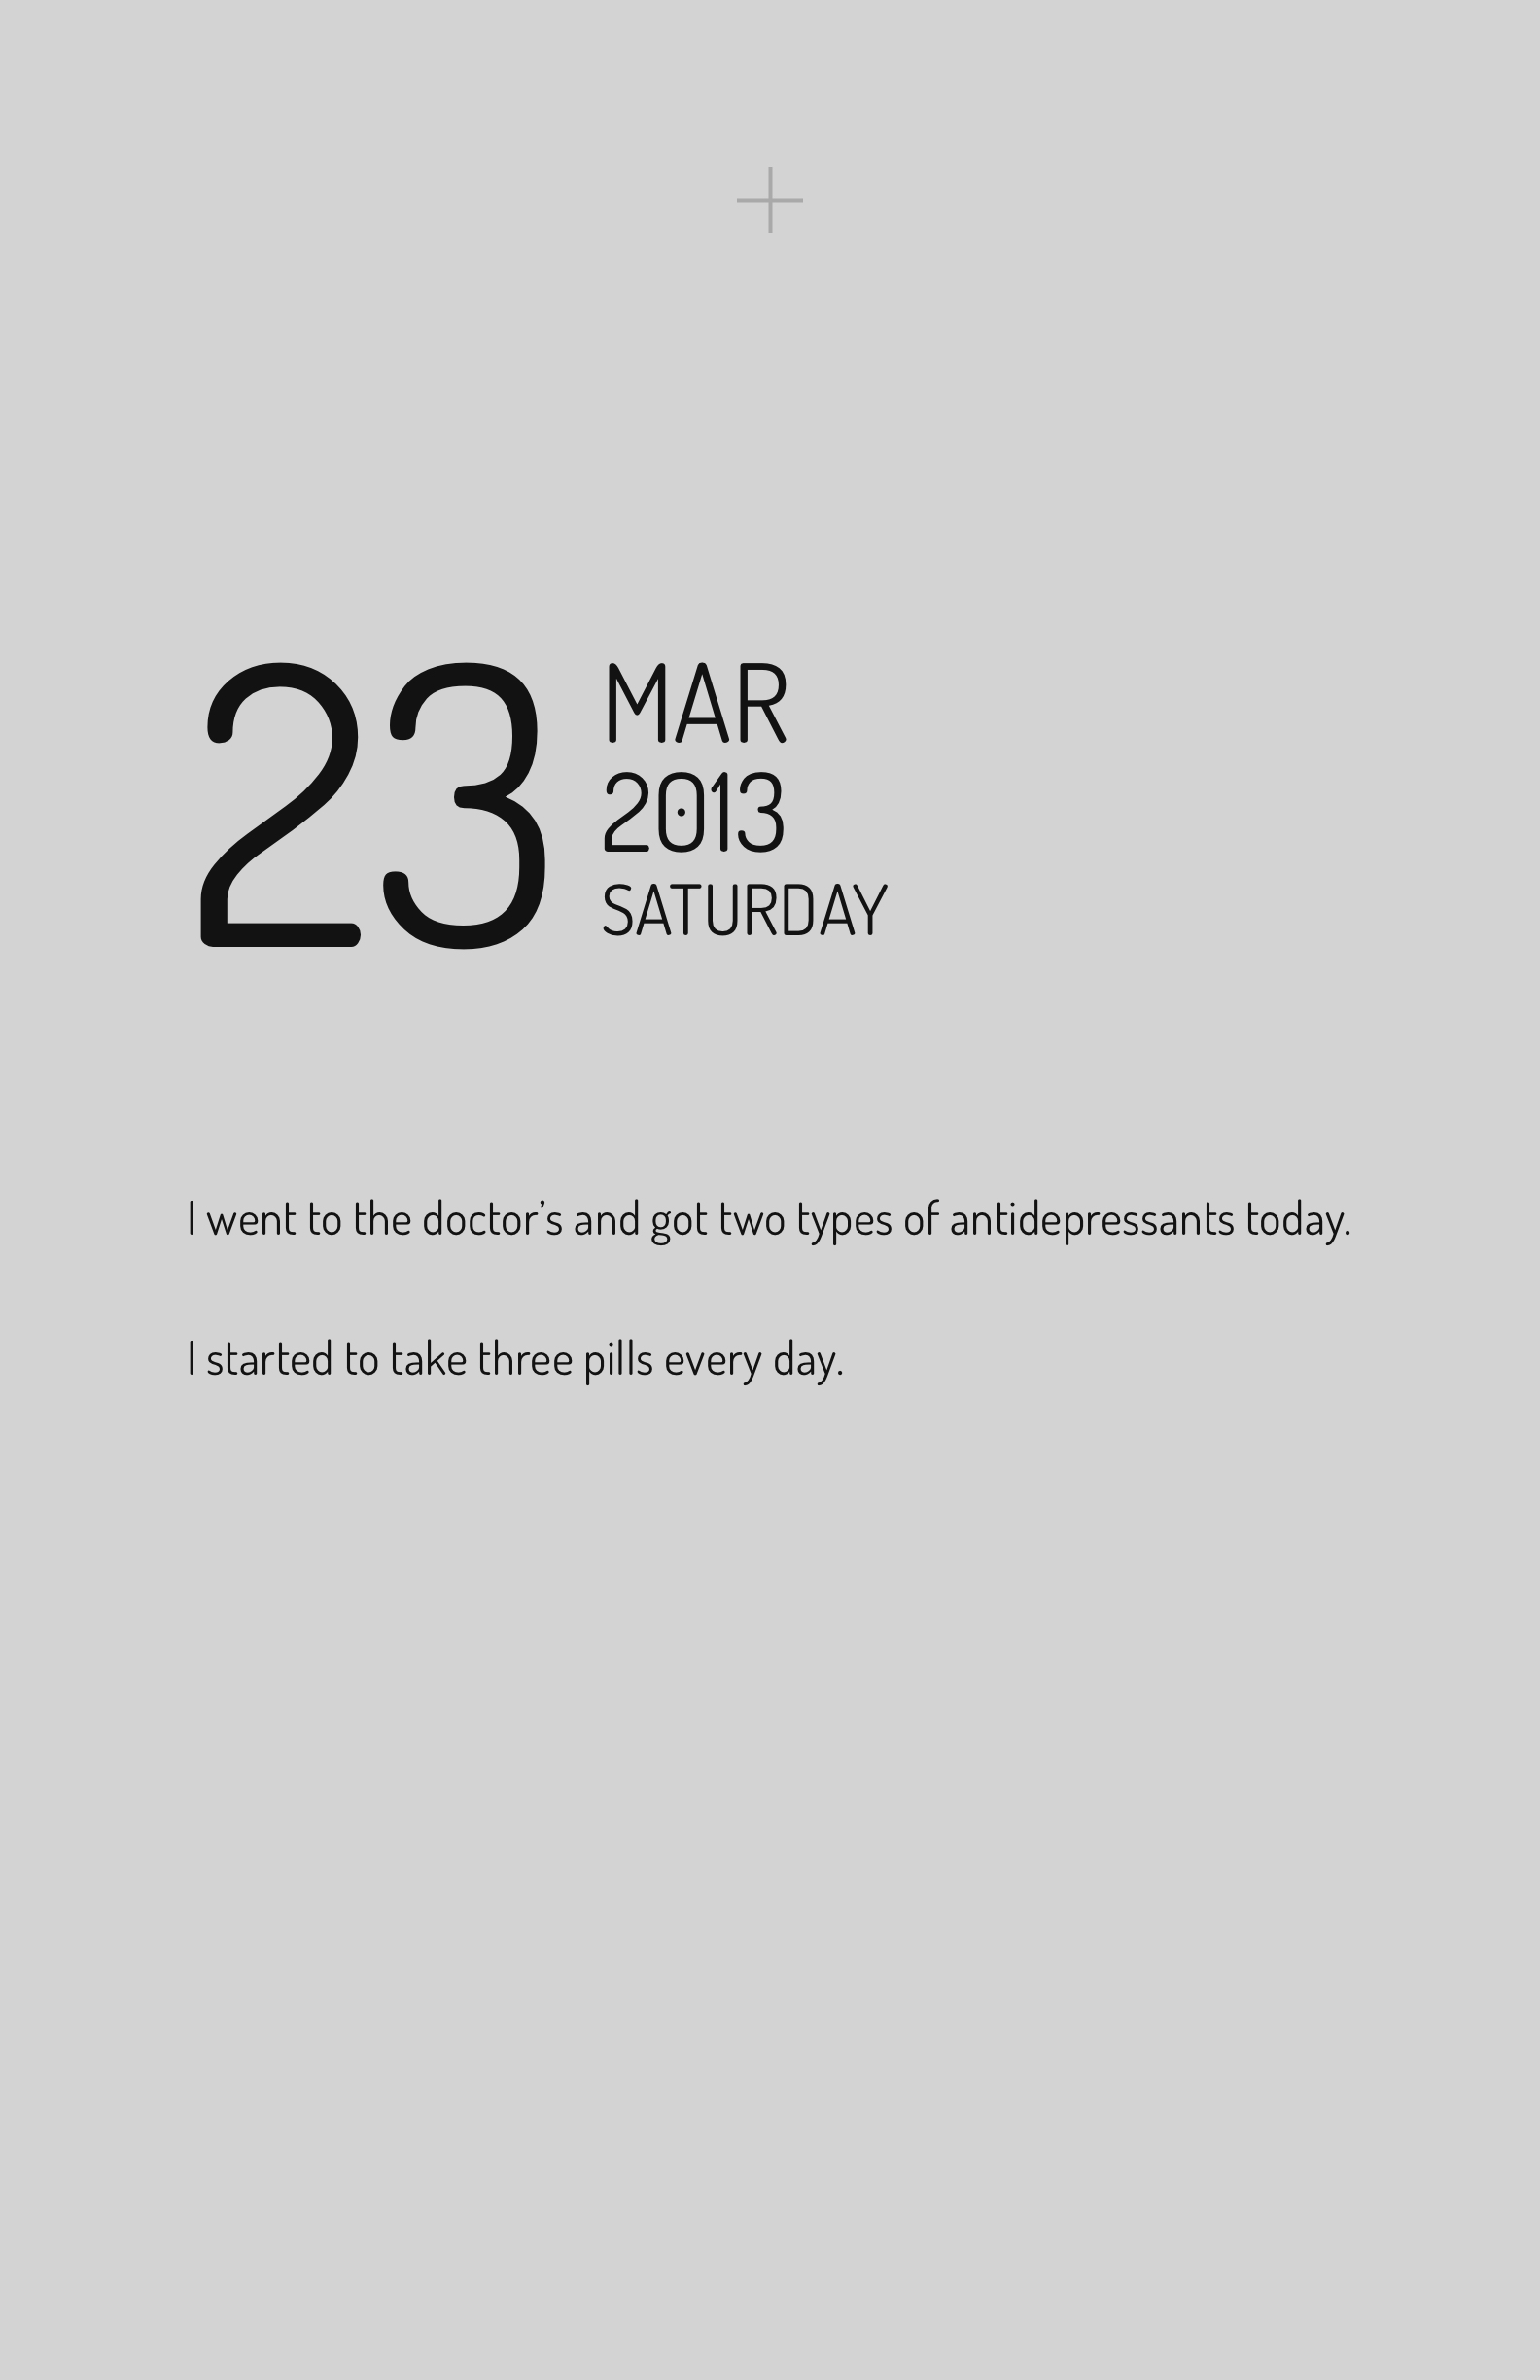
I was diagnosed with moderate depression and used prescribed antidepressants to treat depression for some time.
Luckily, I didn’t stop my personal ritual of taking a photo every day in those days.
So, I have the opportunity to visualize my personal life from the photos I captured during that period.
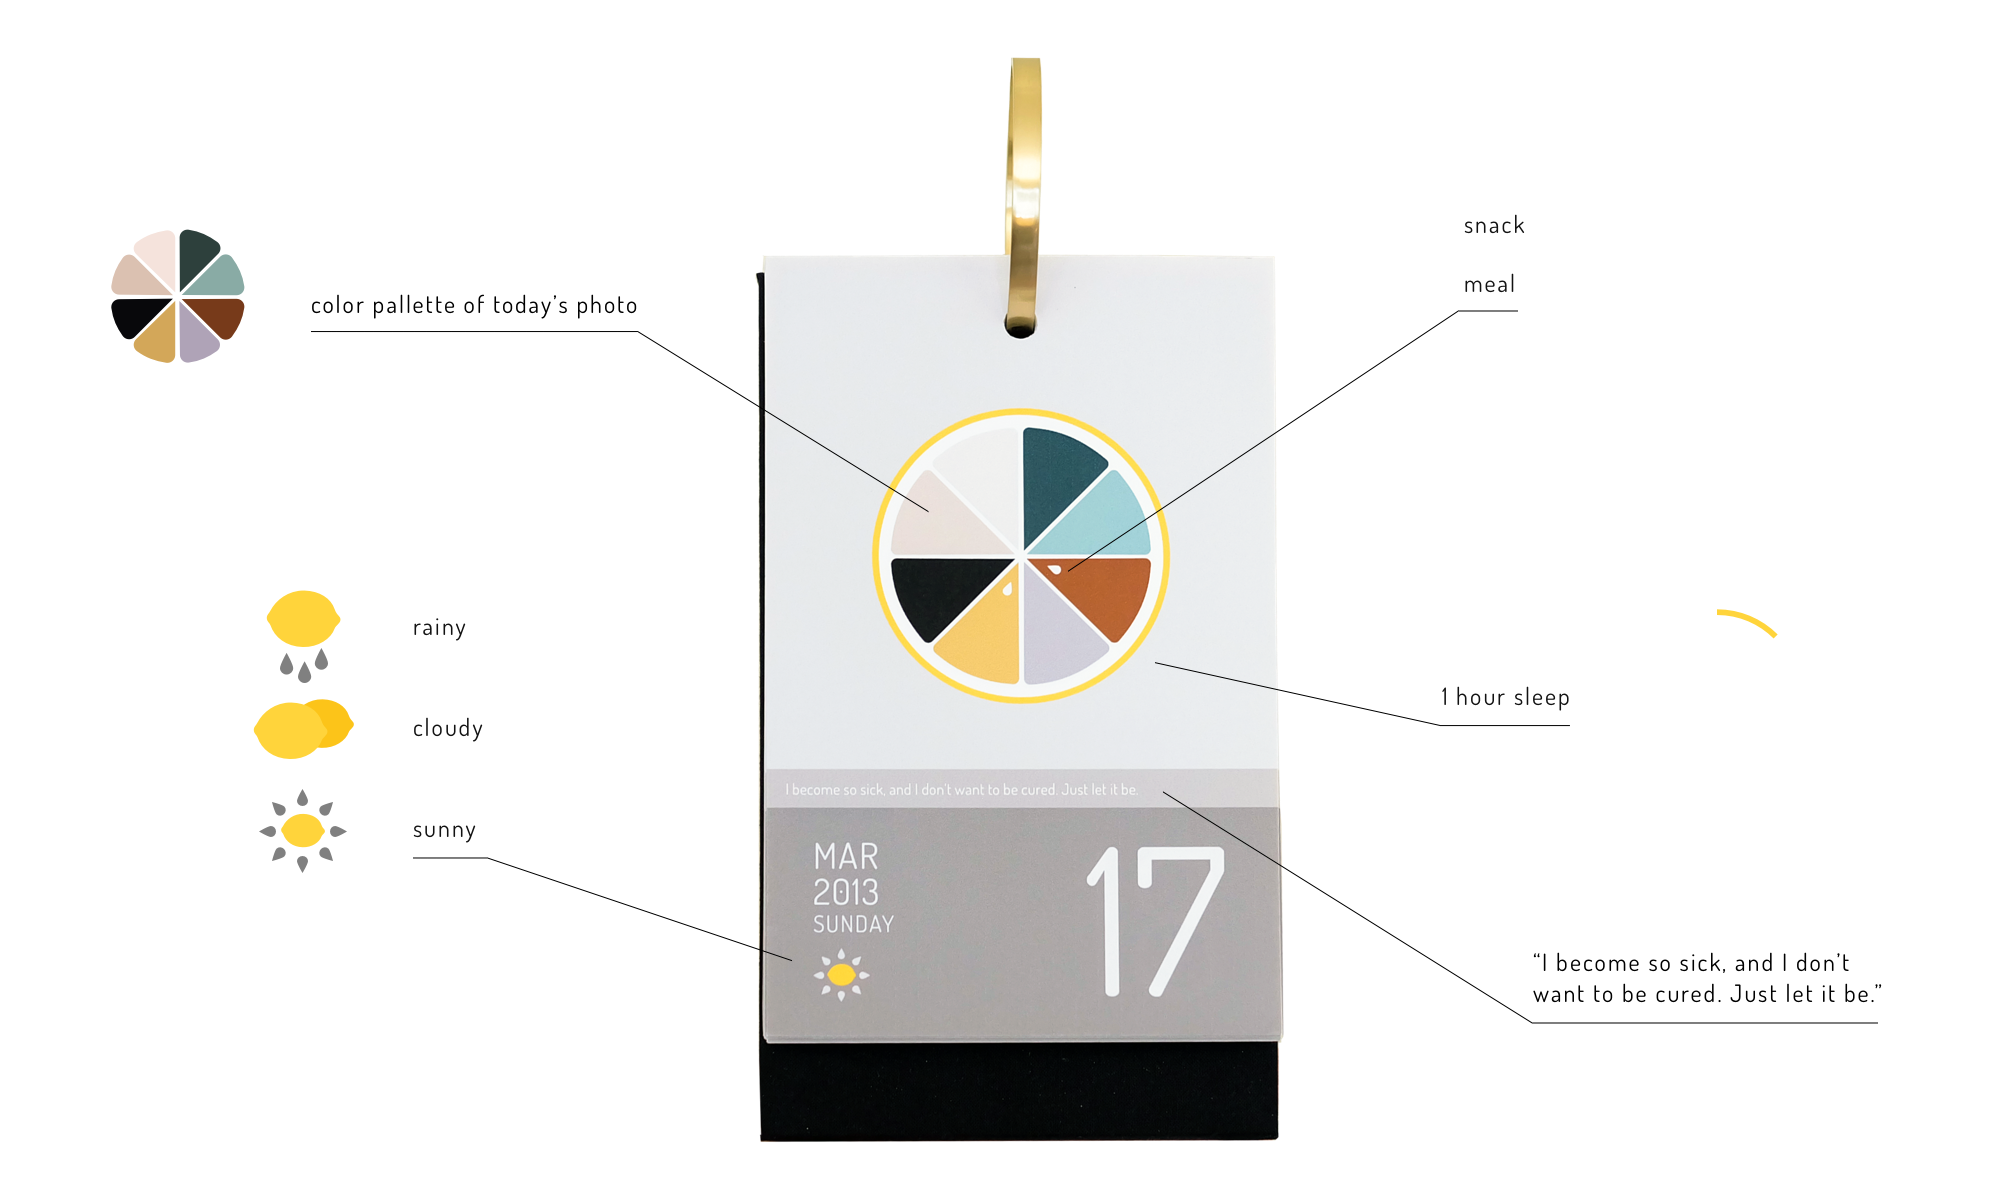
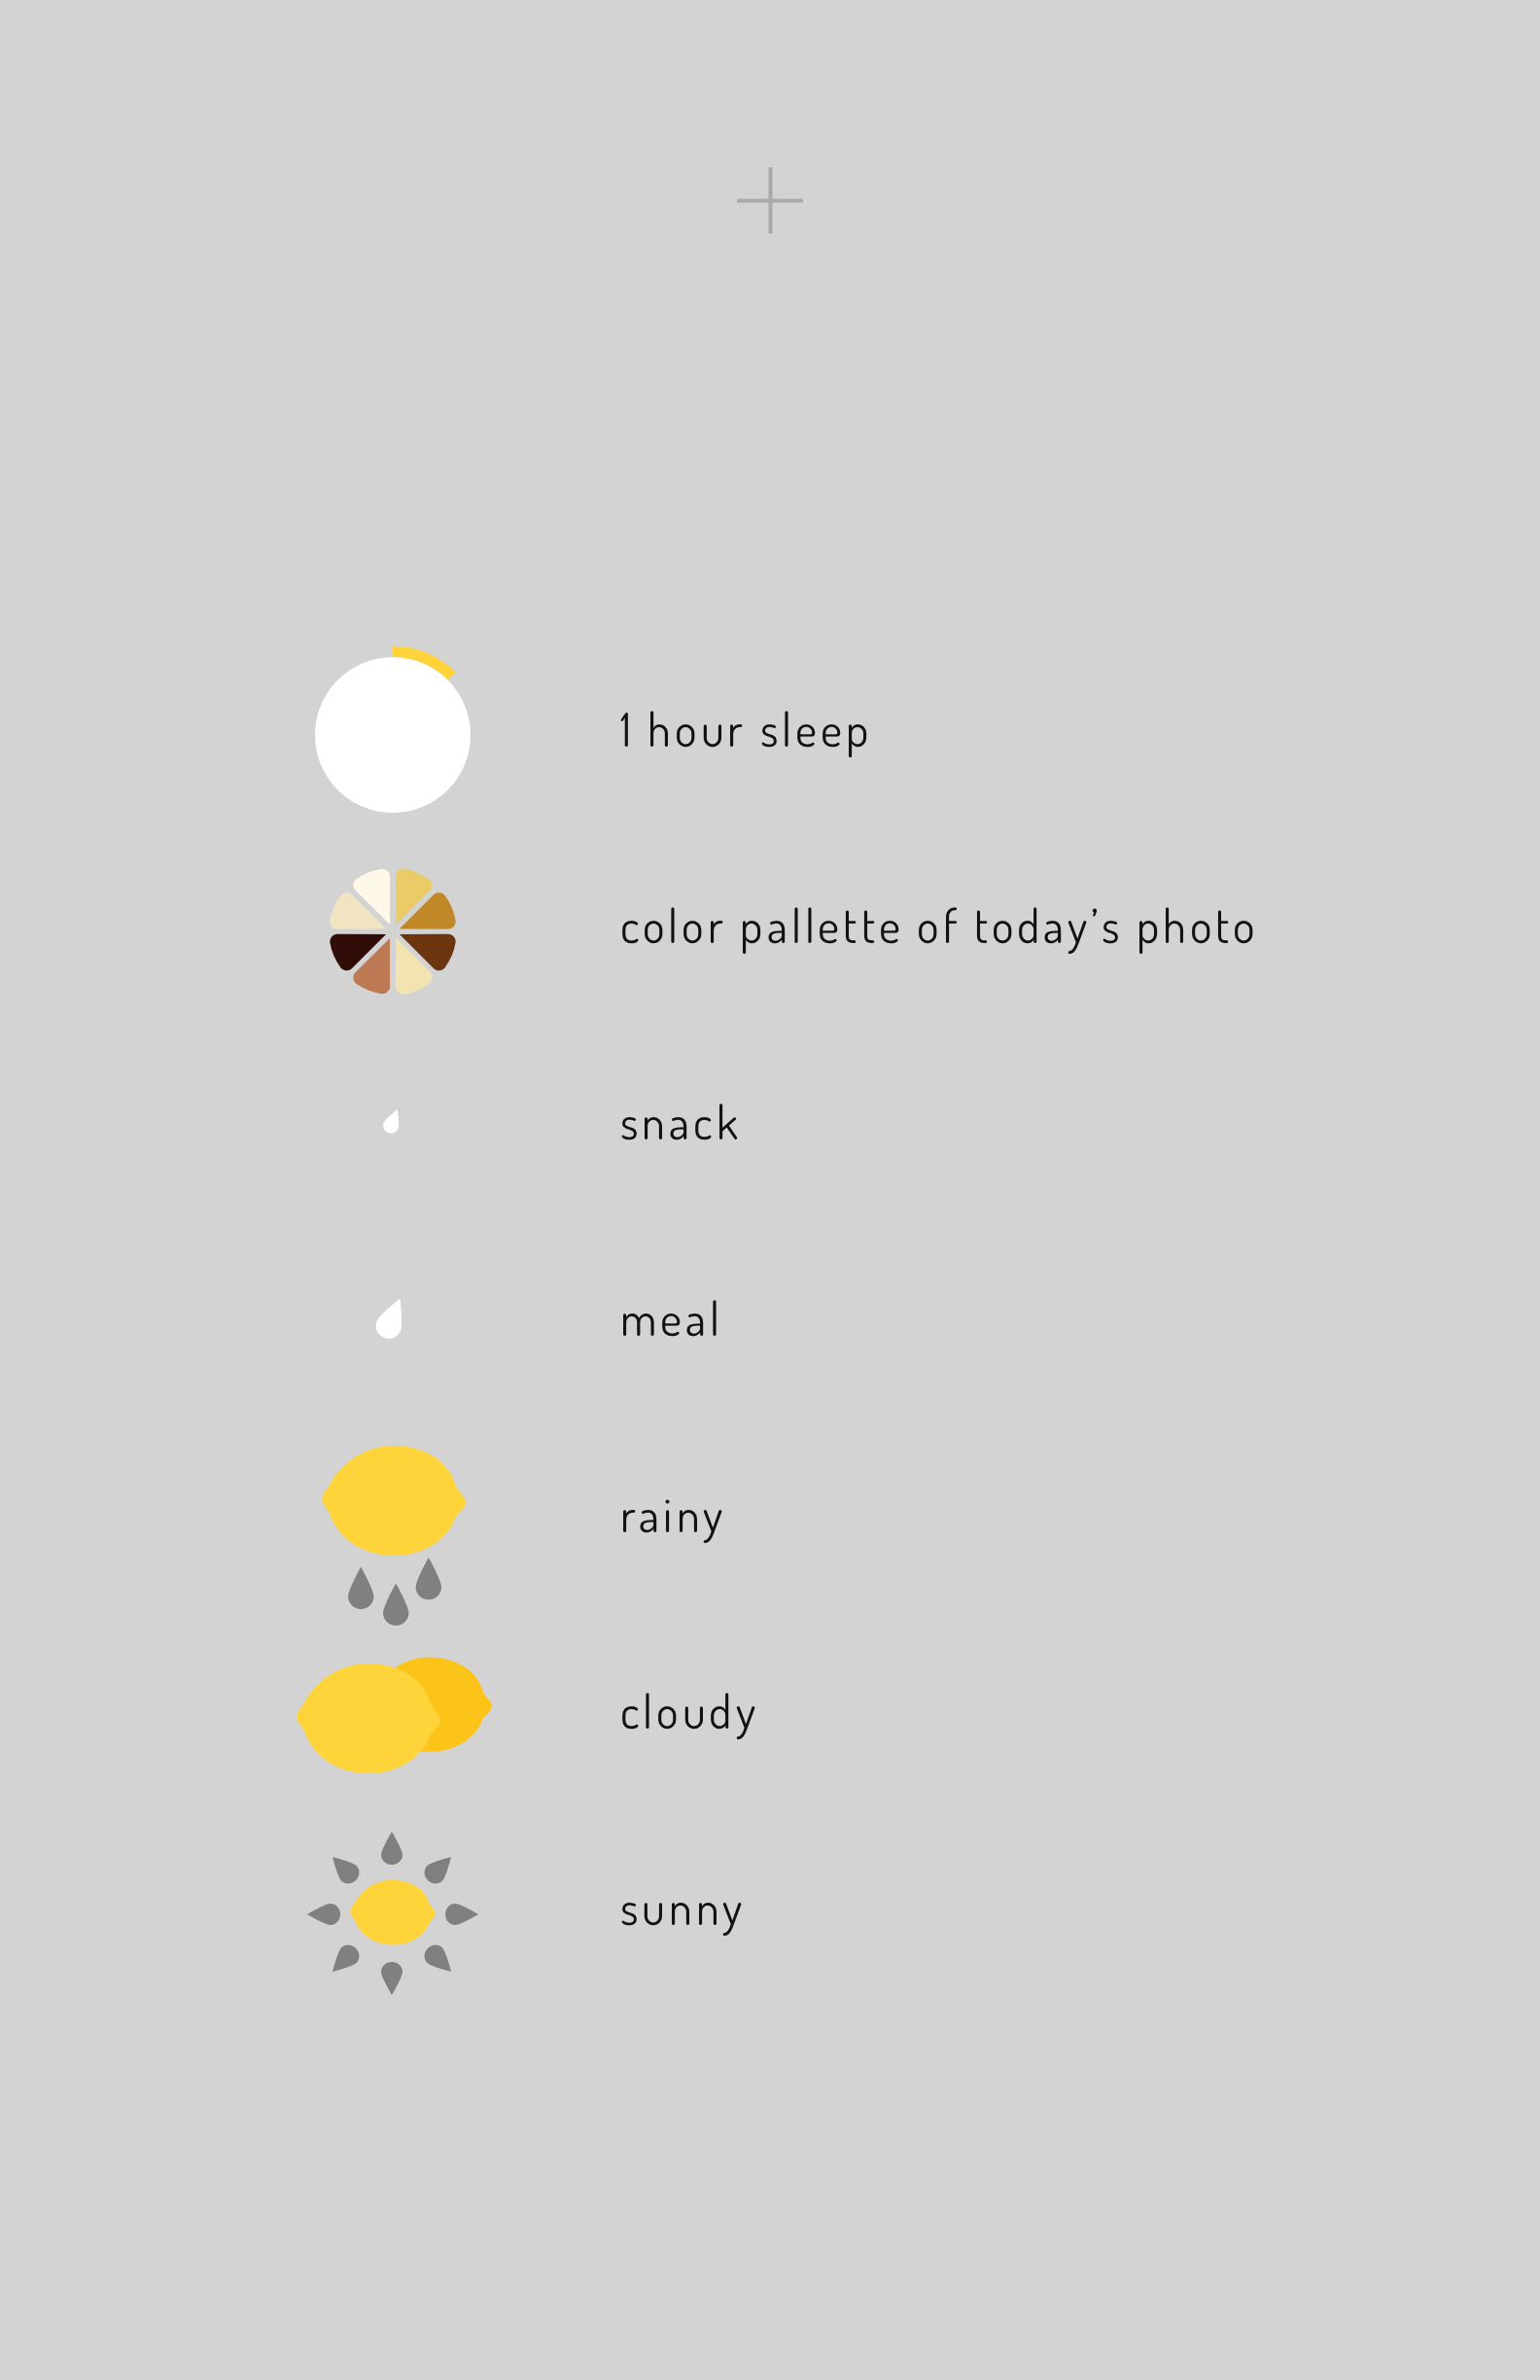
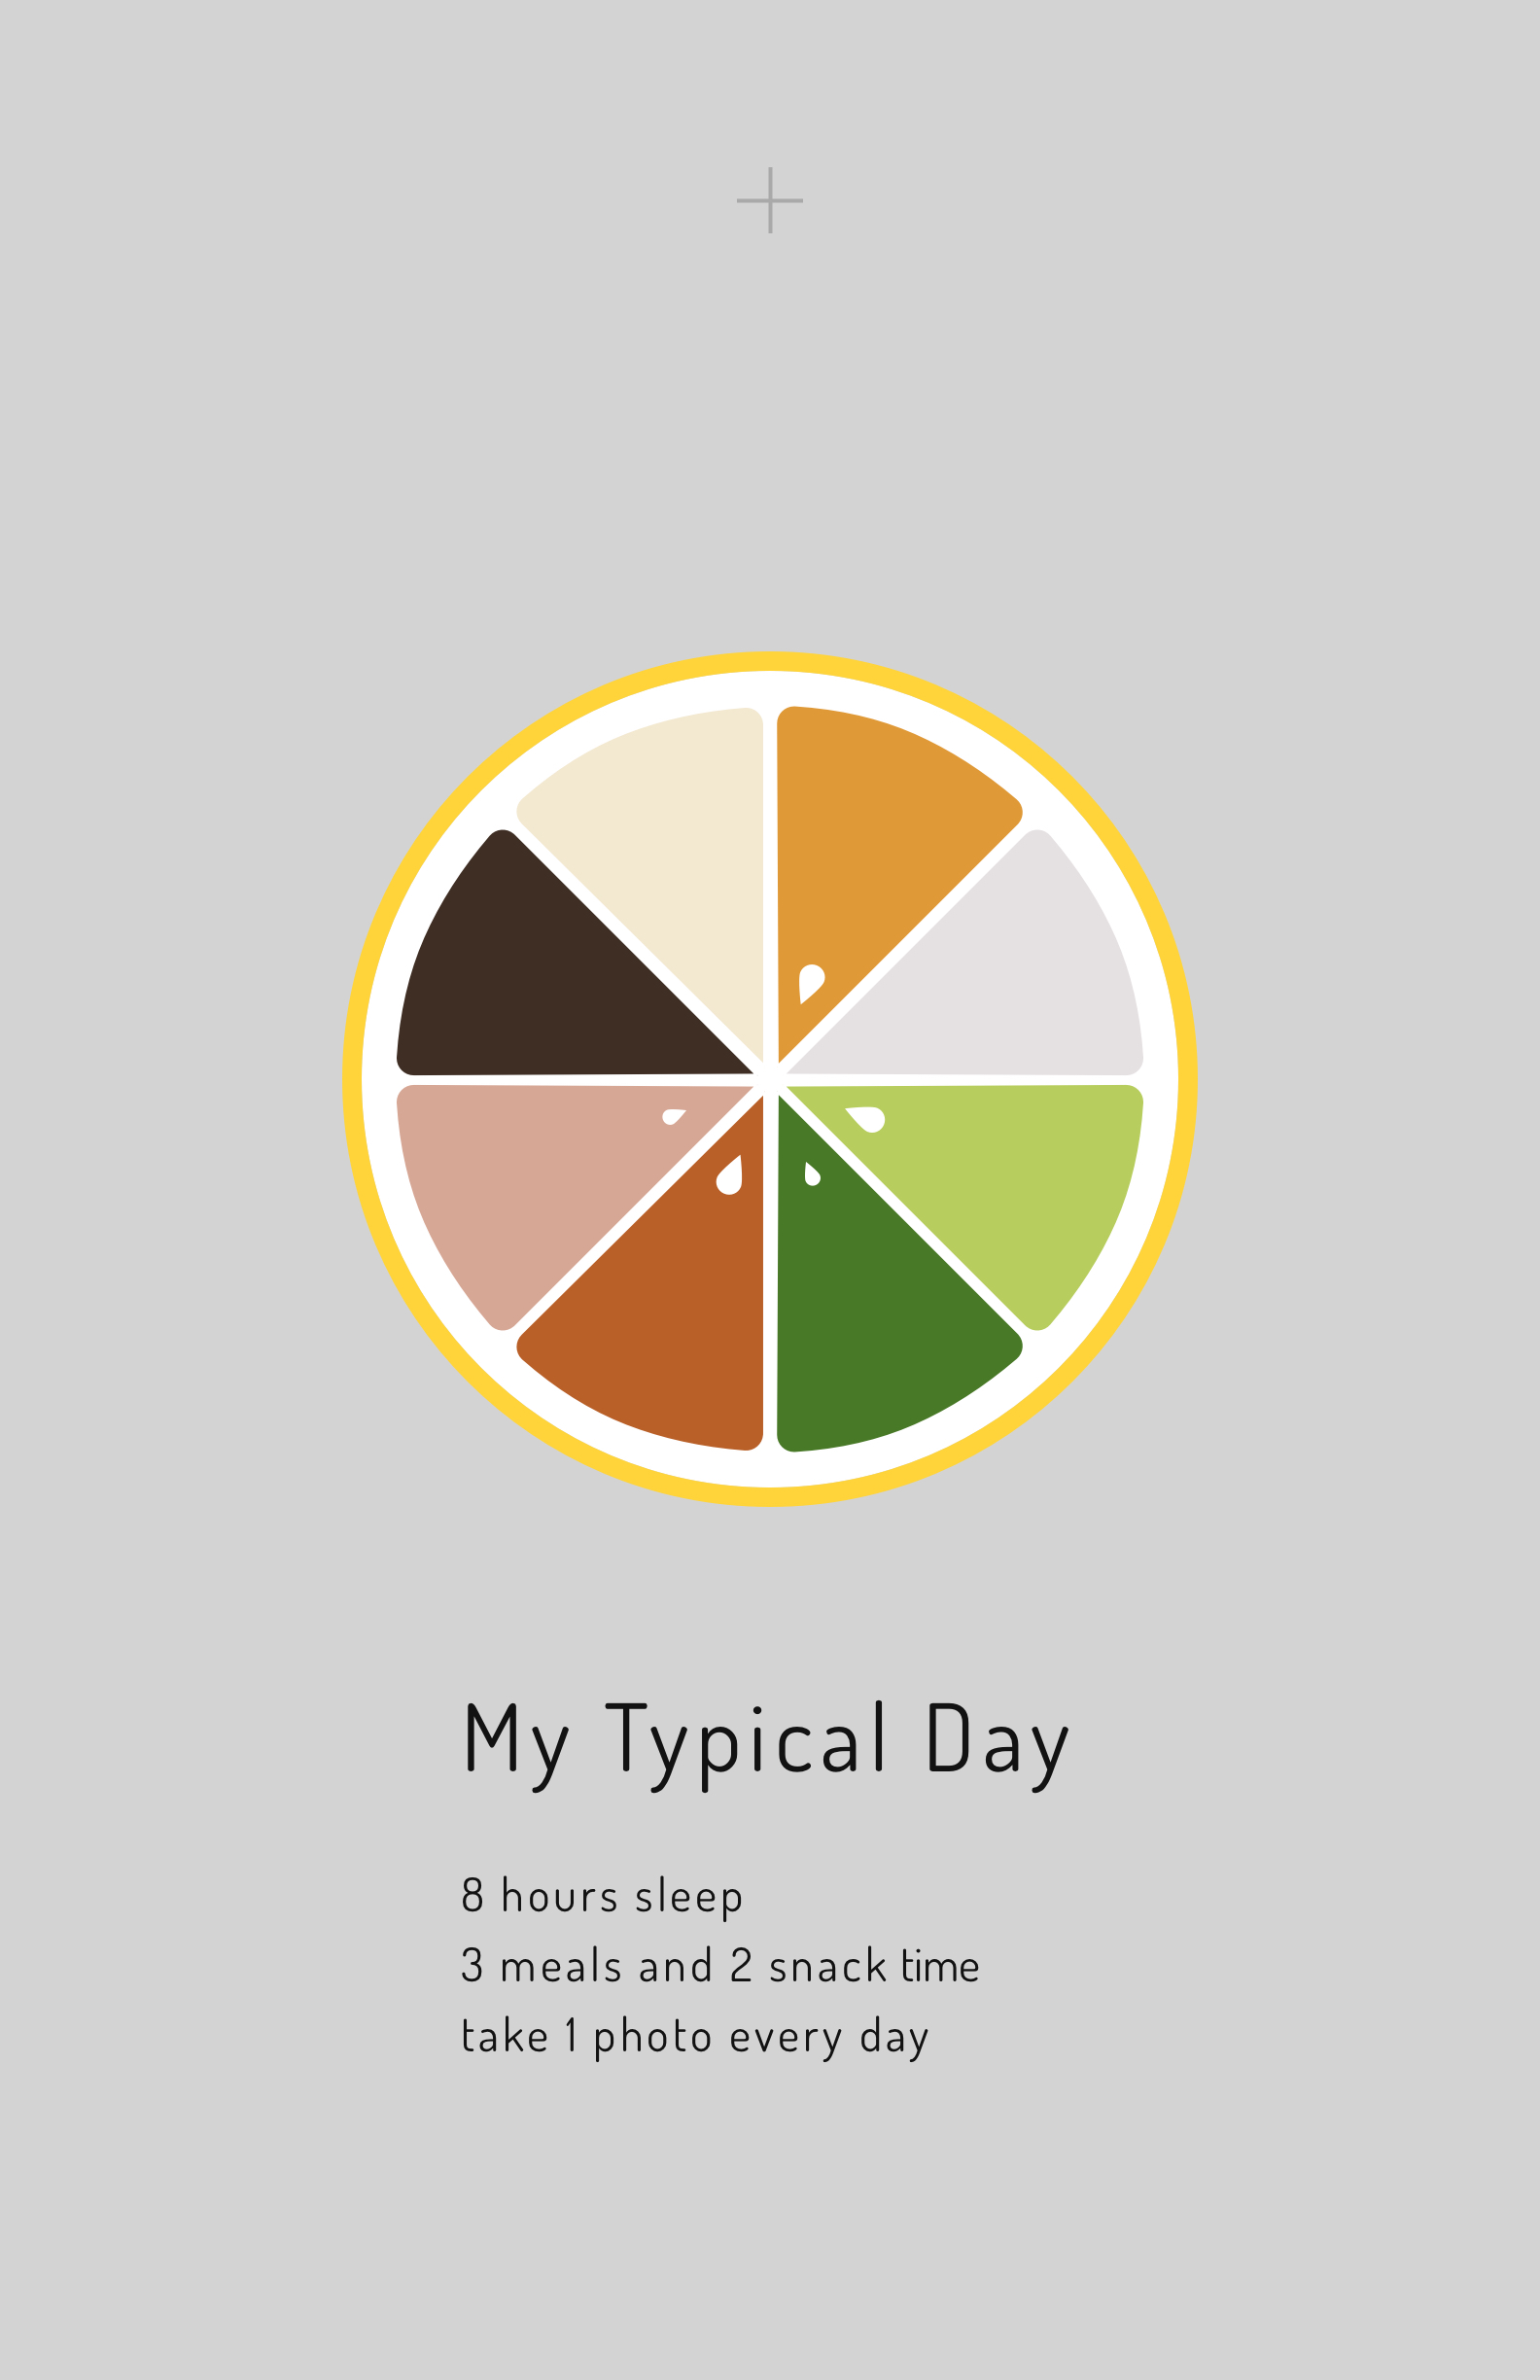
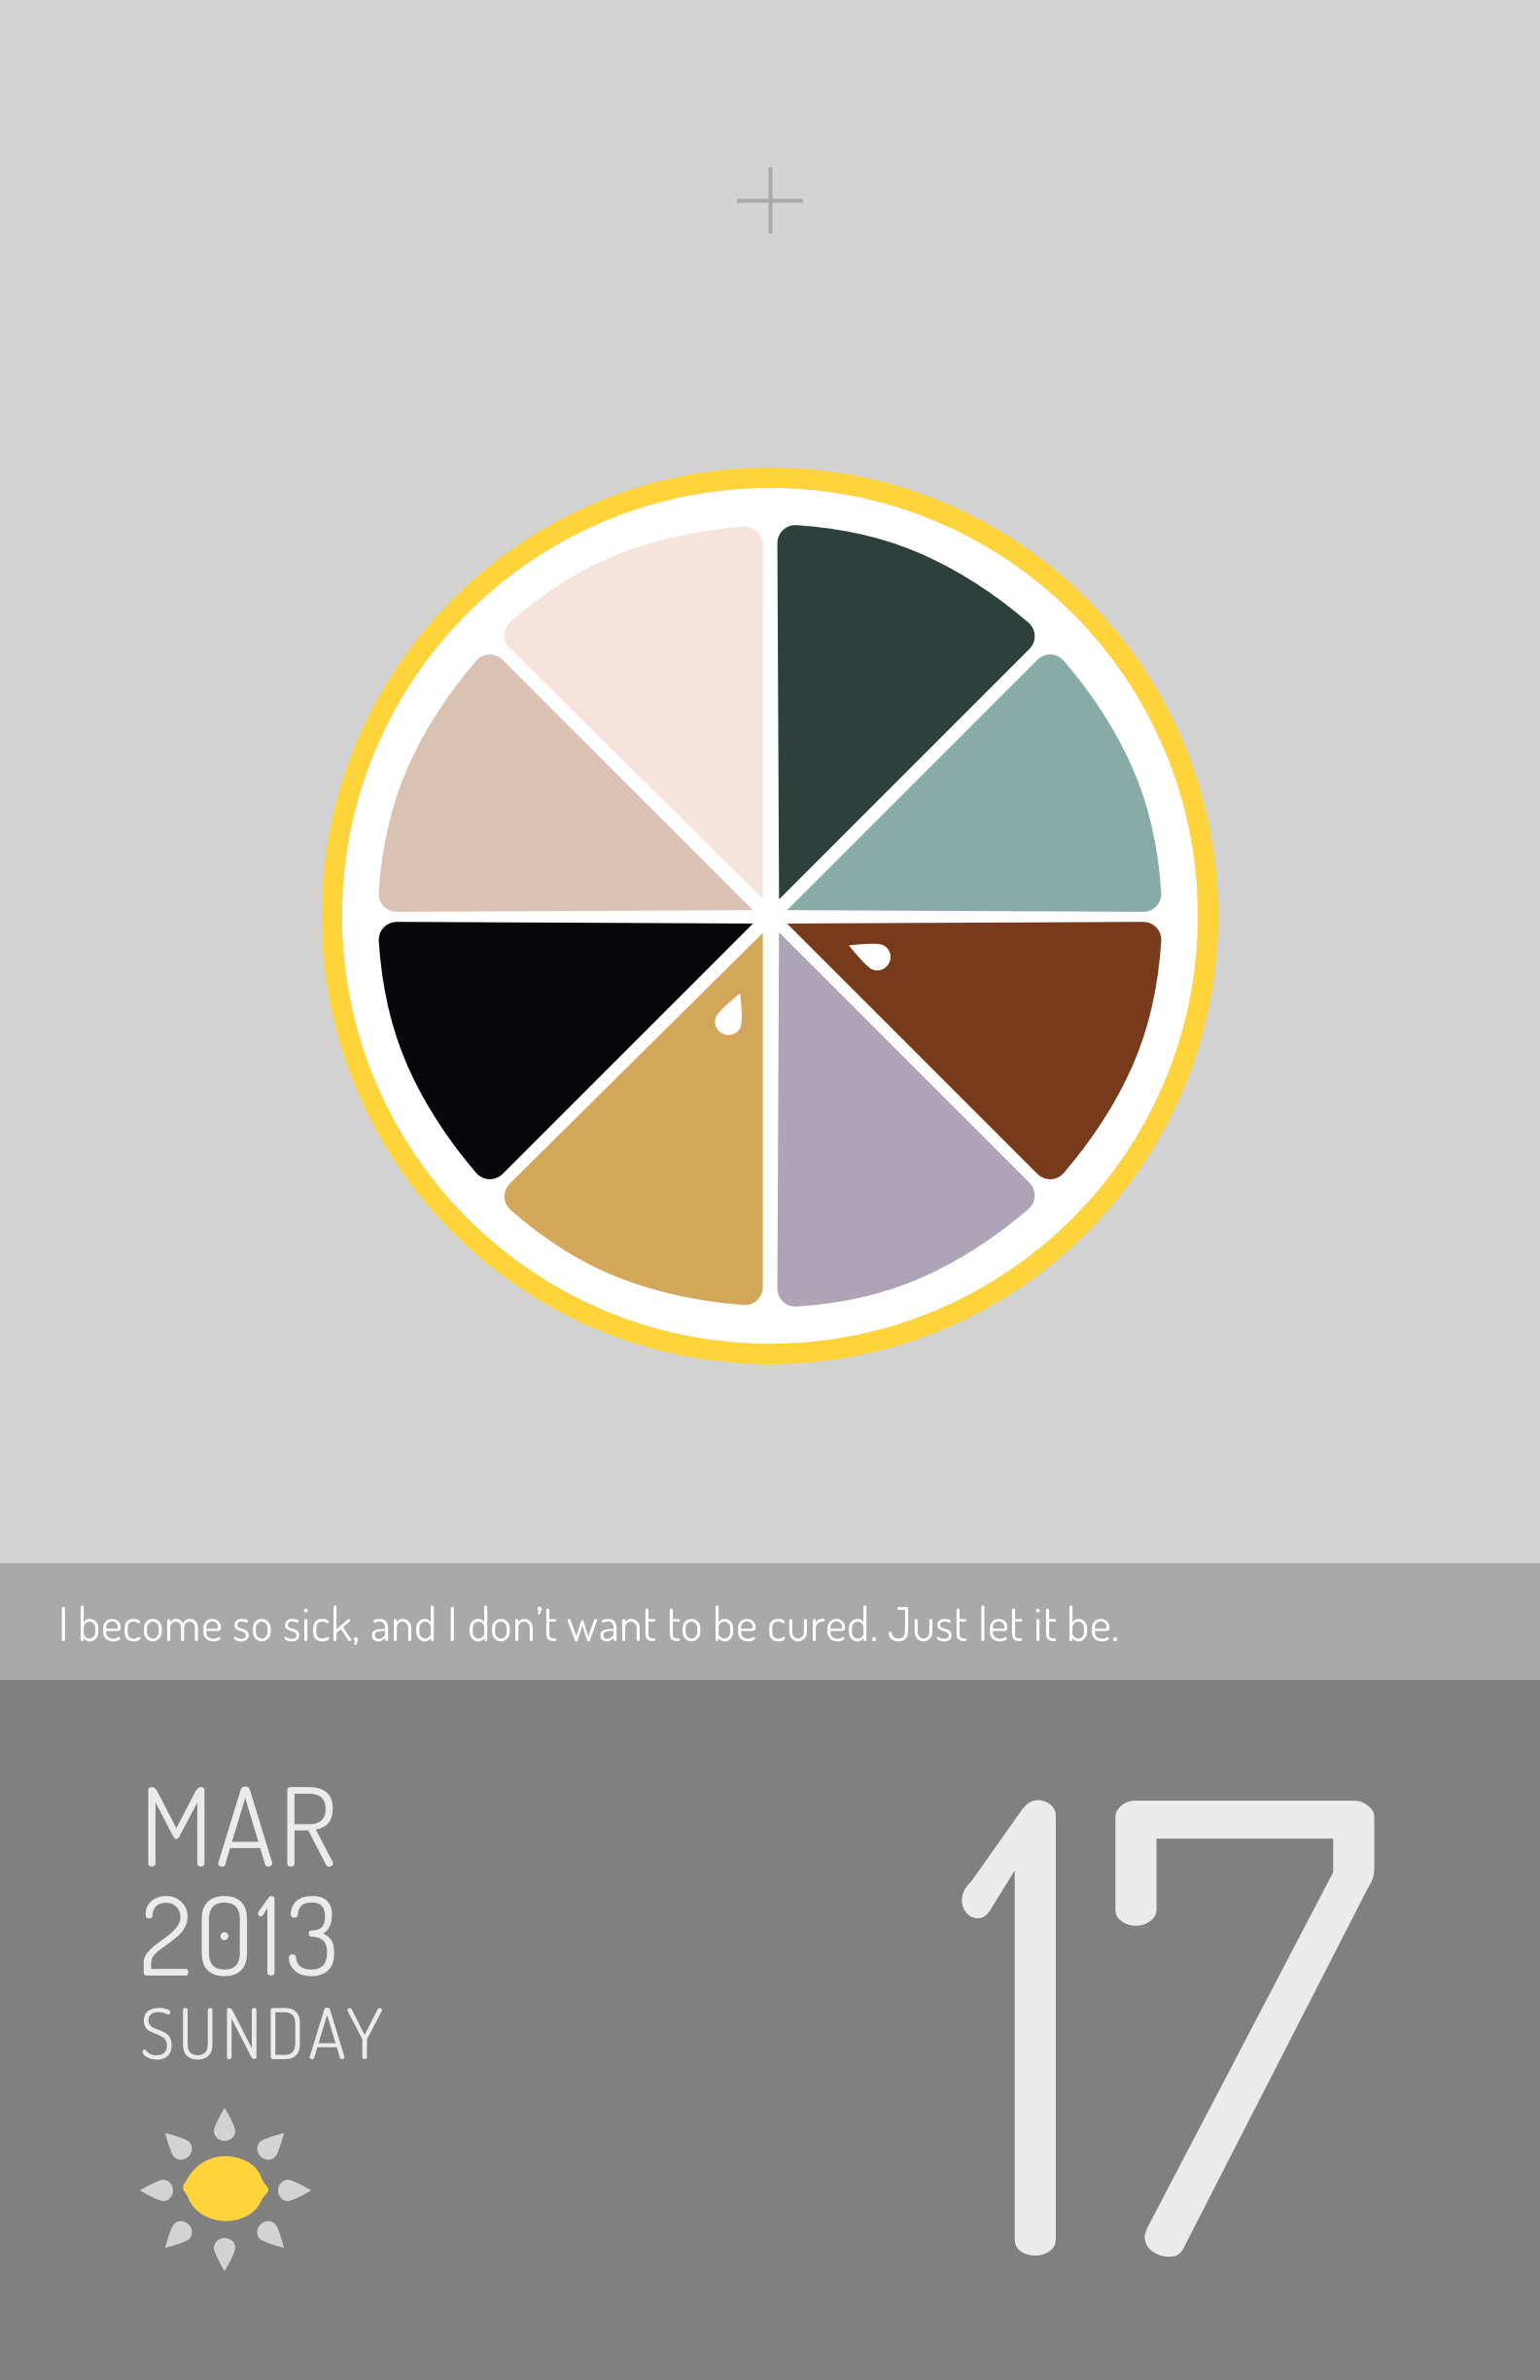
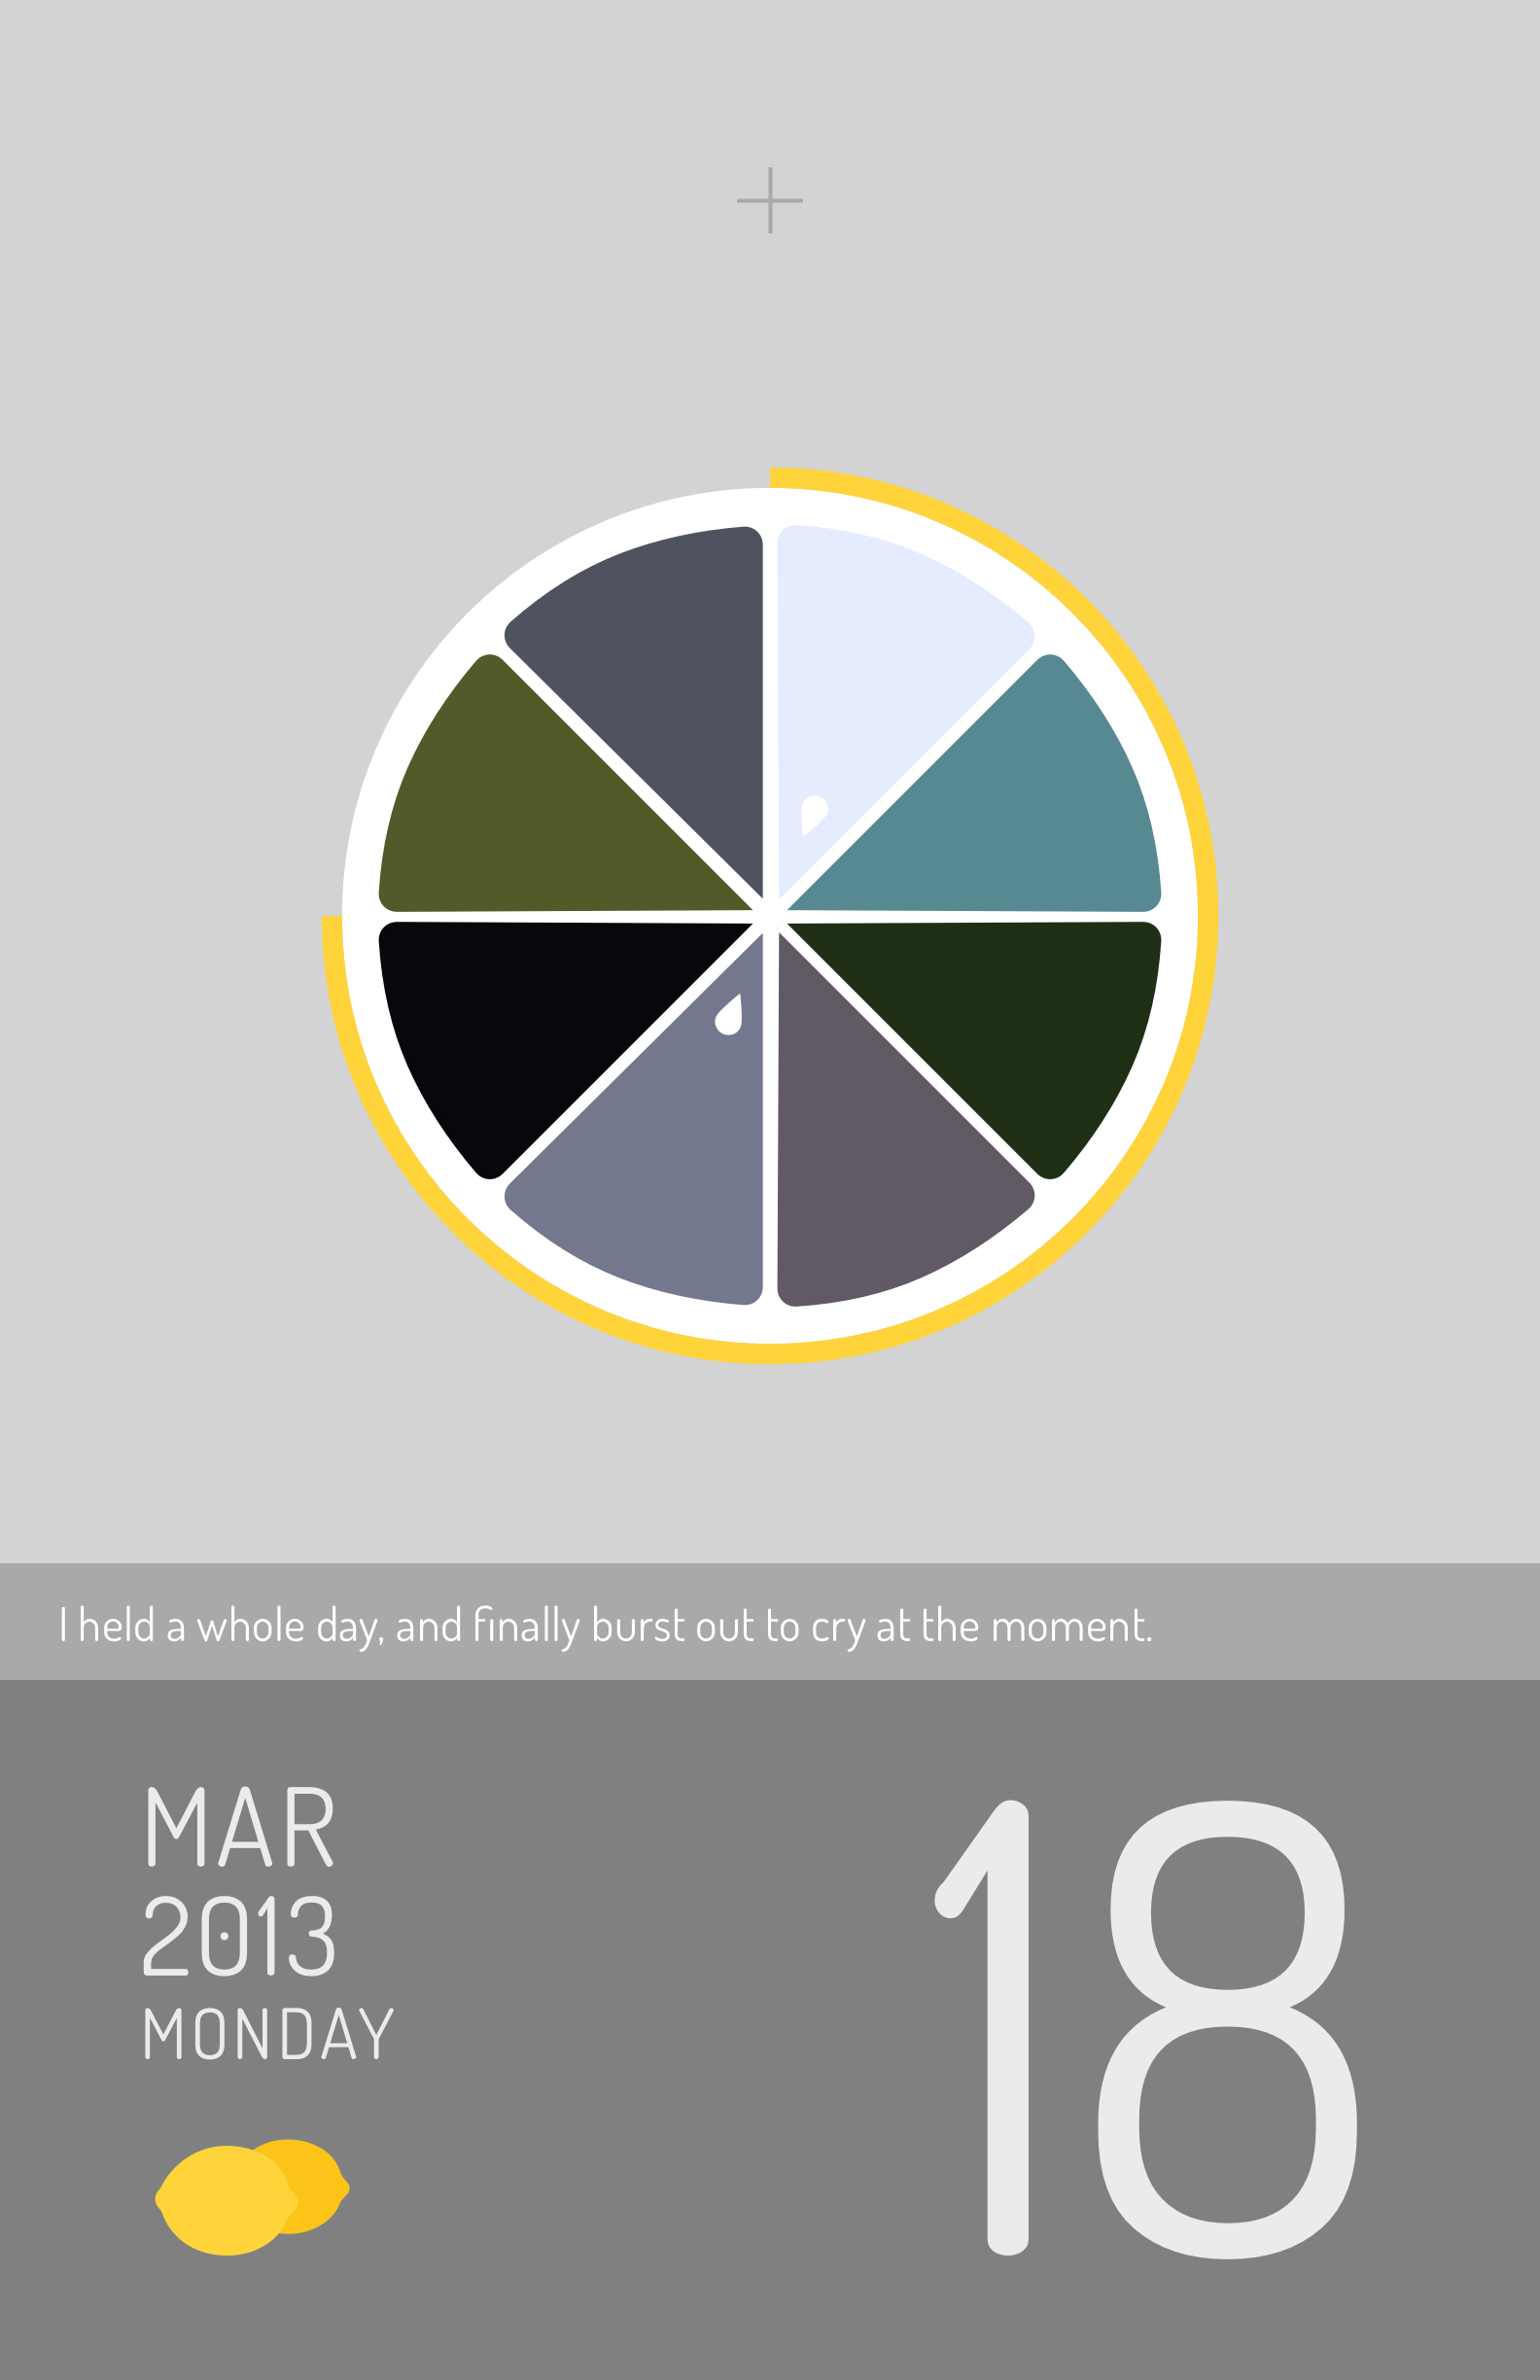
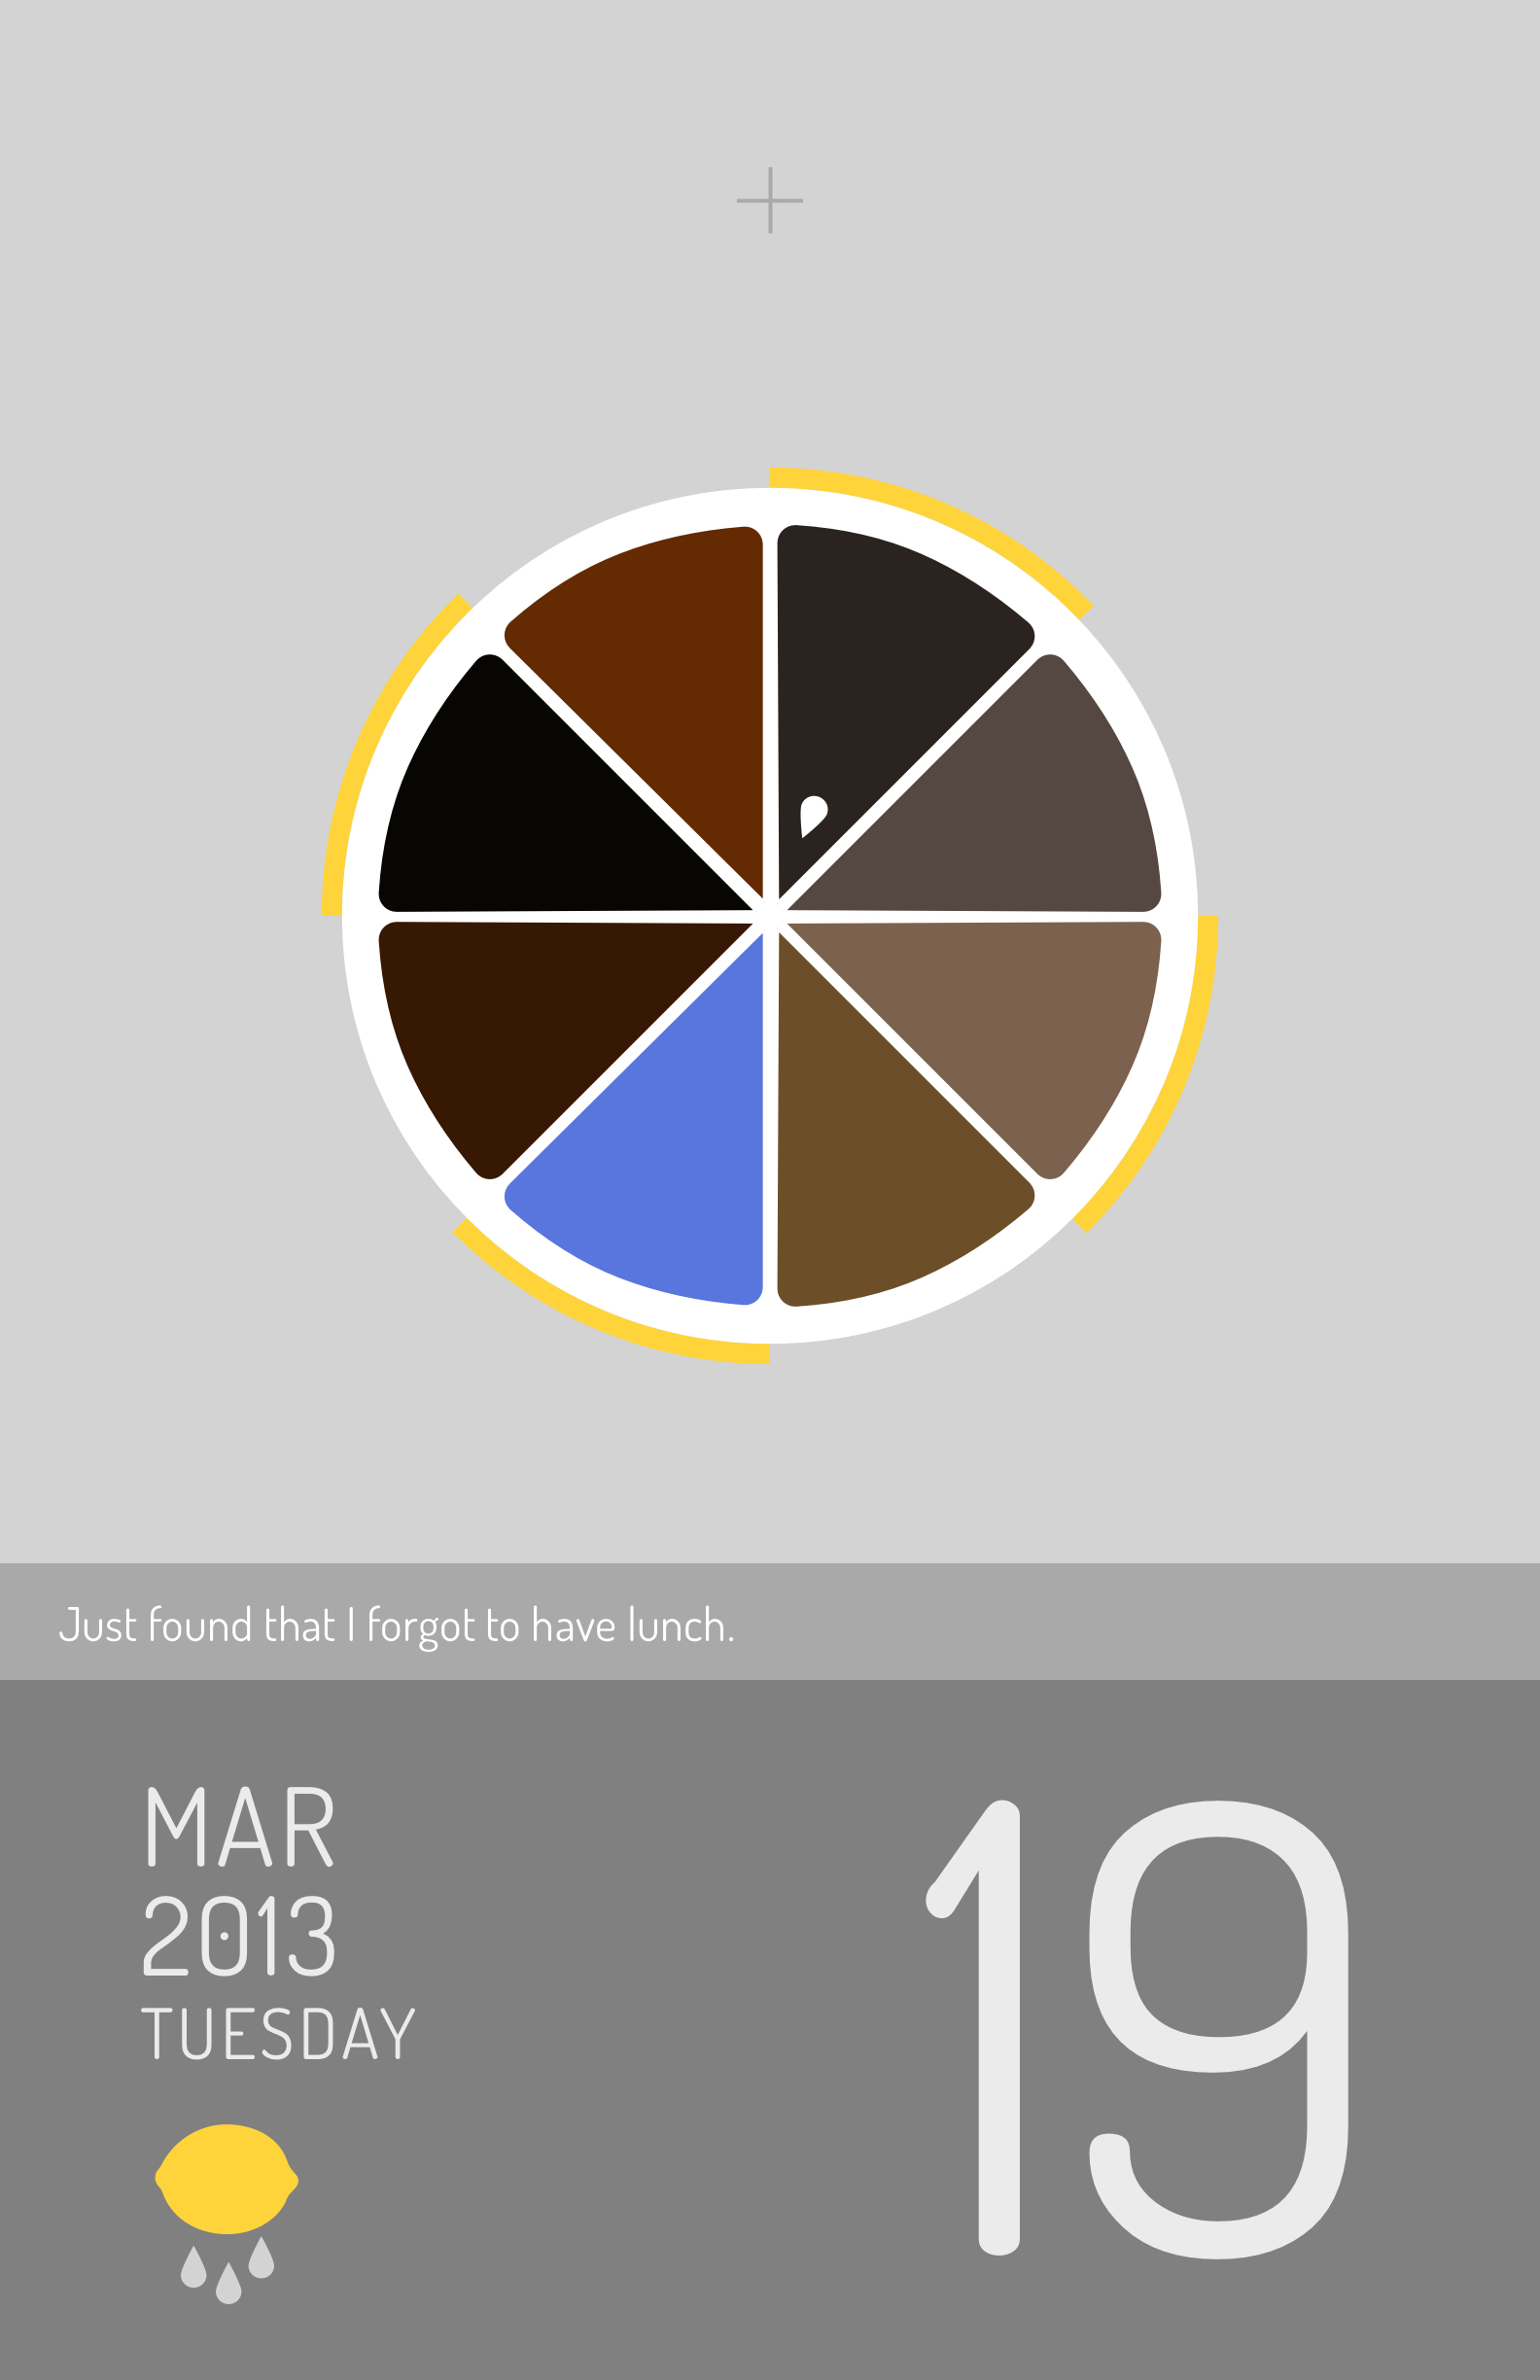
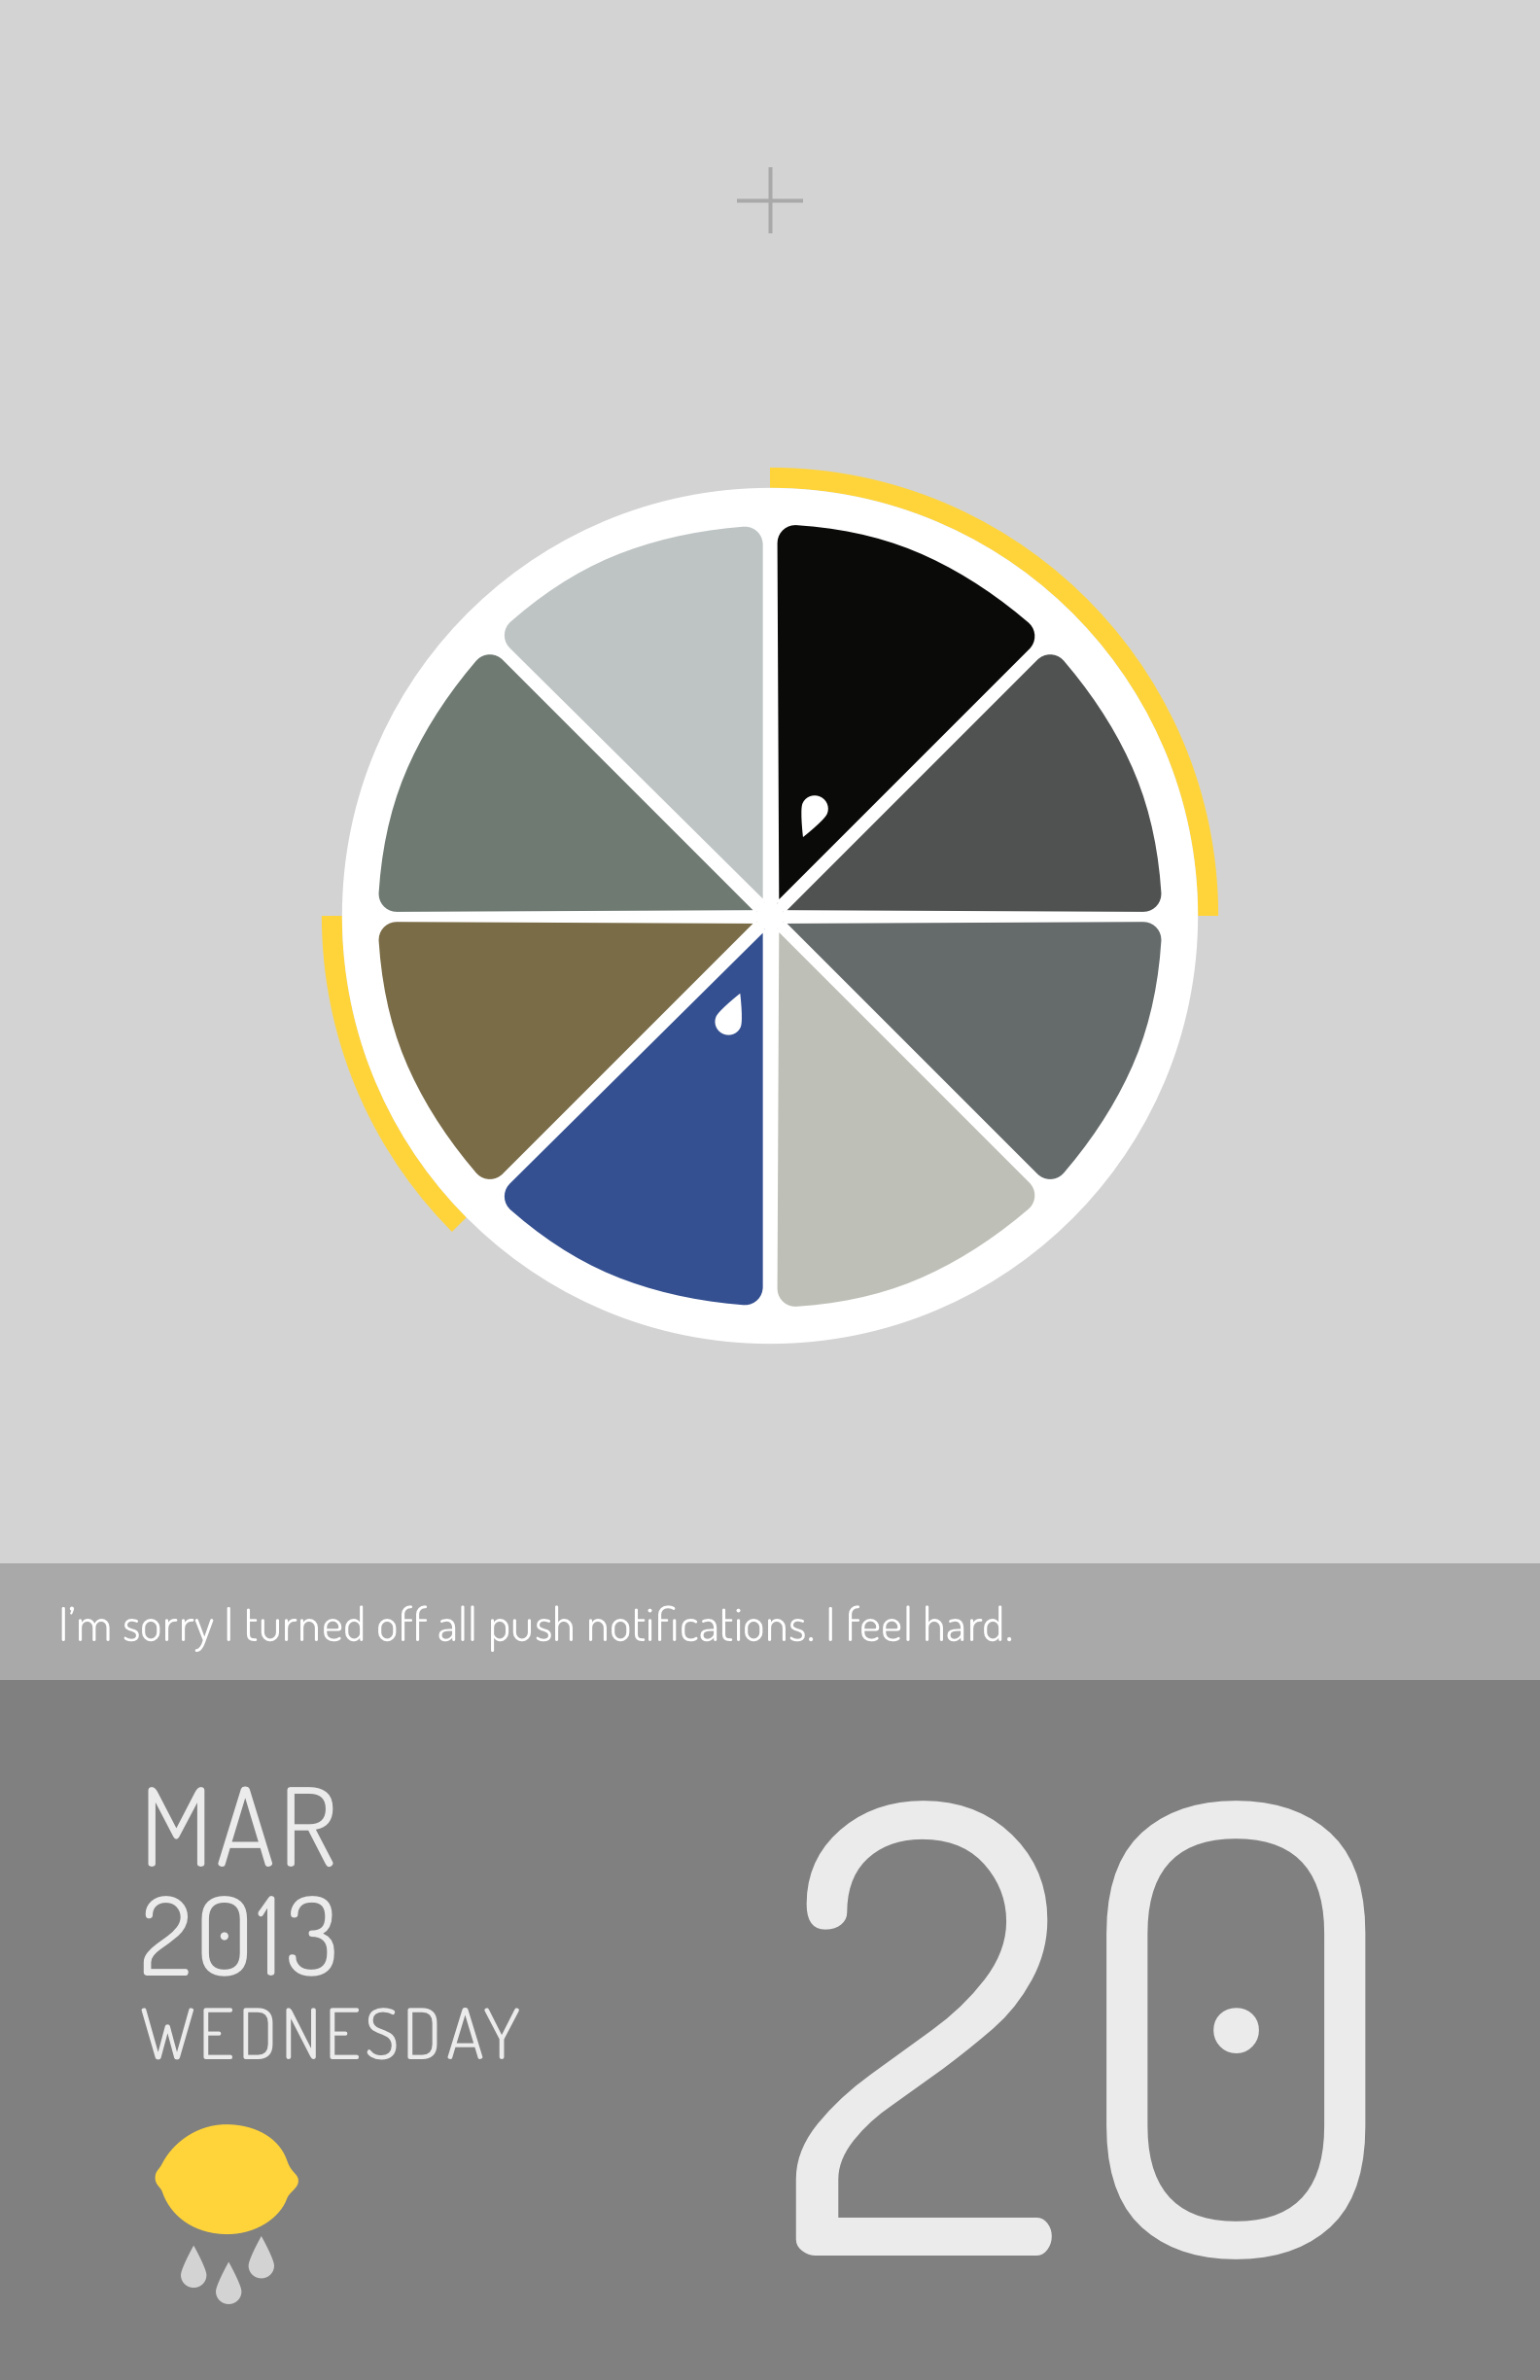
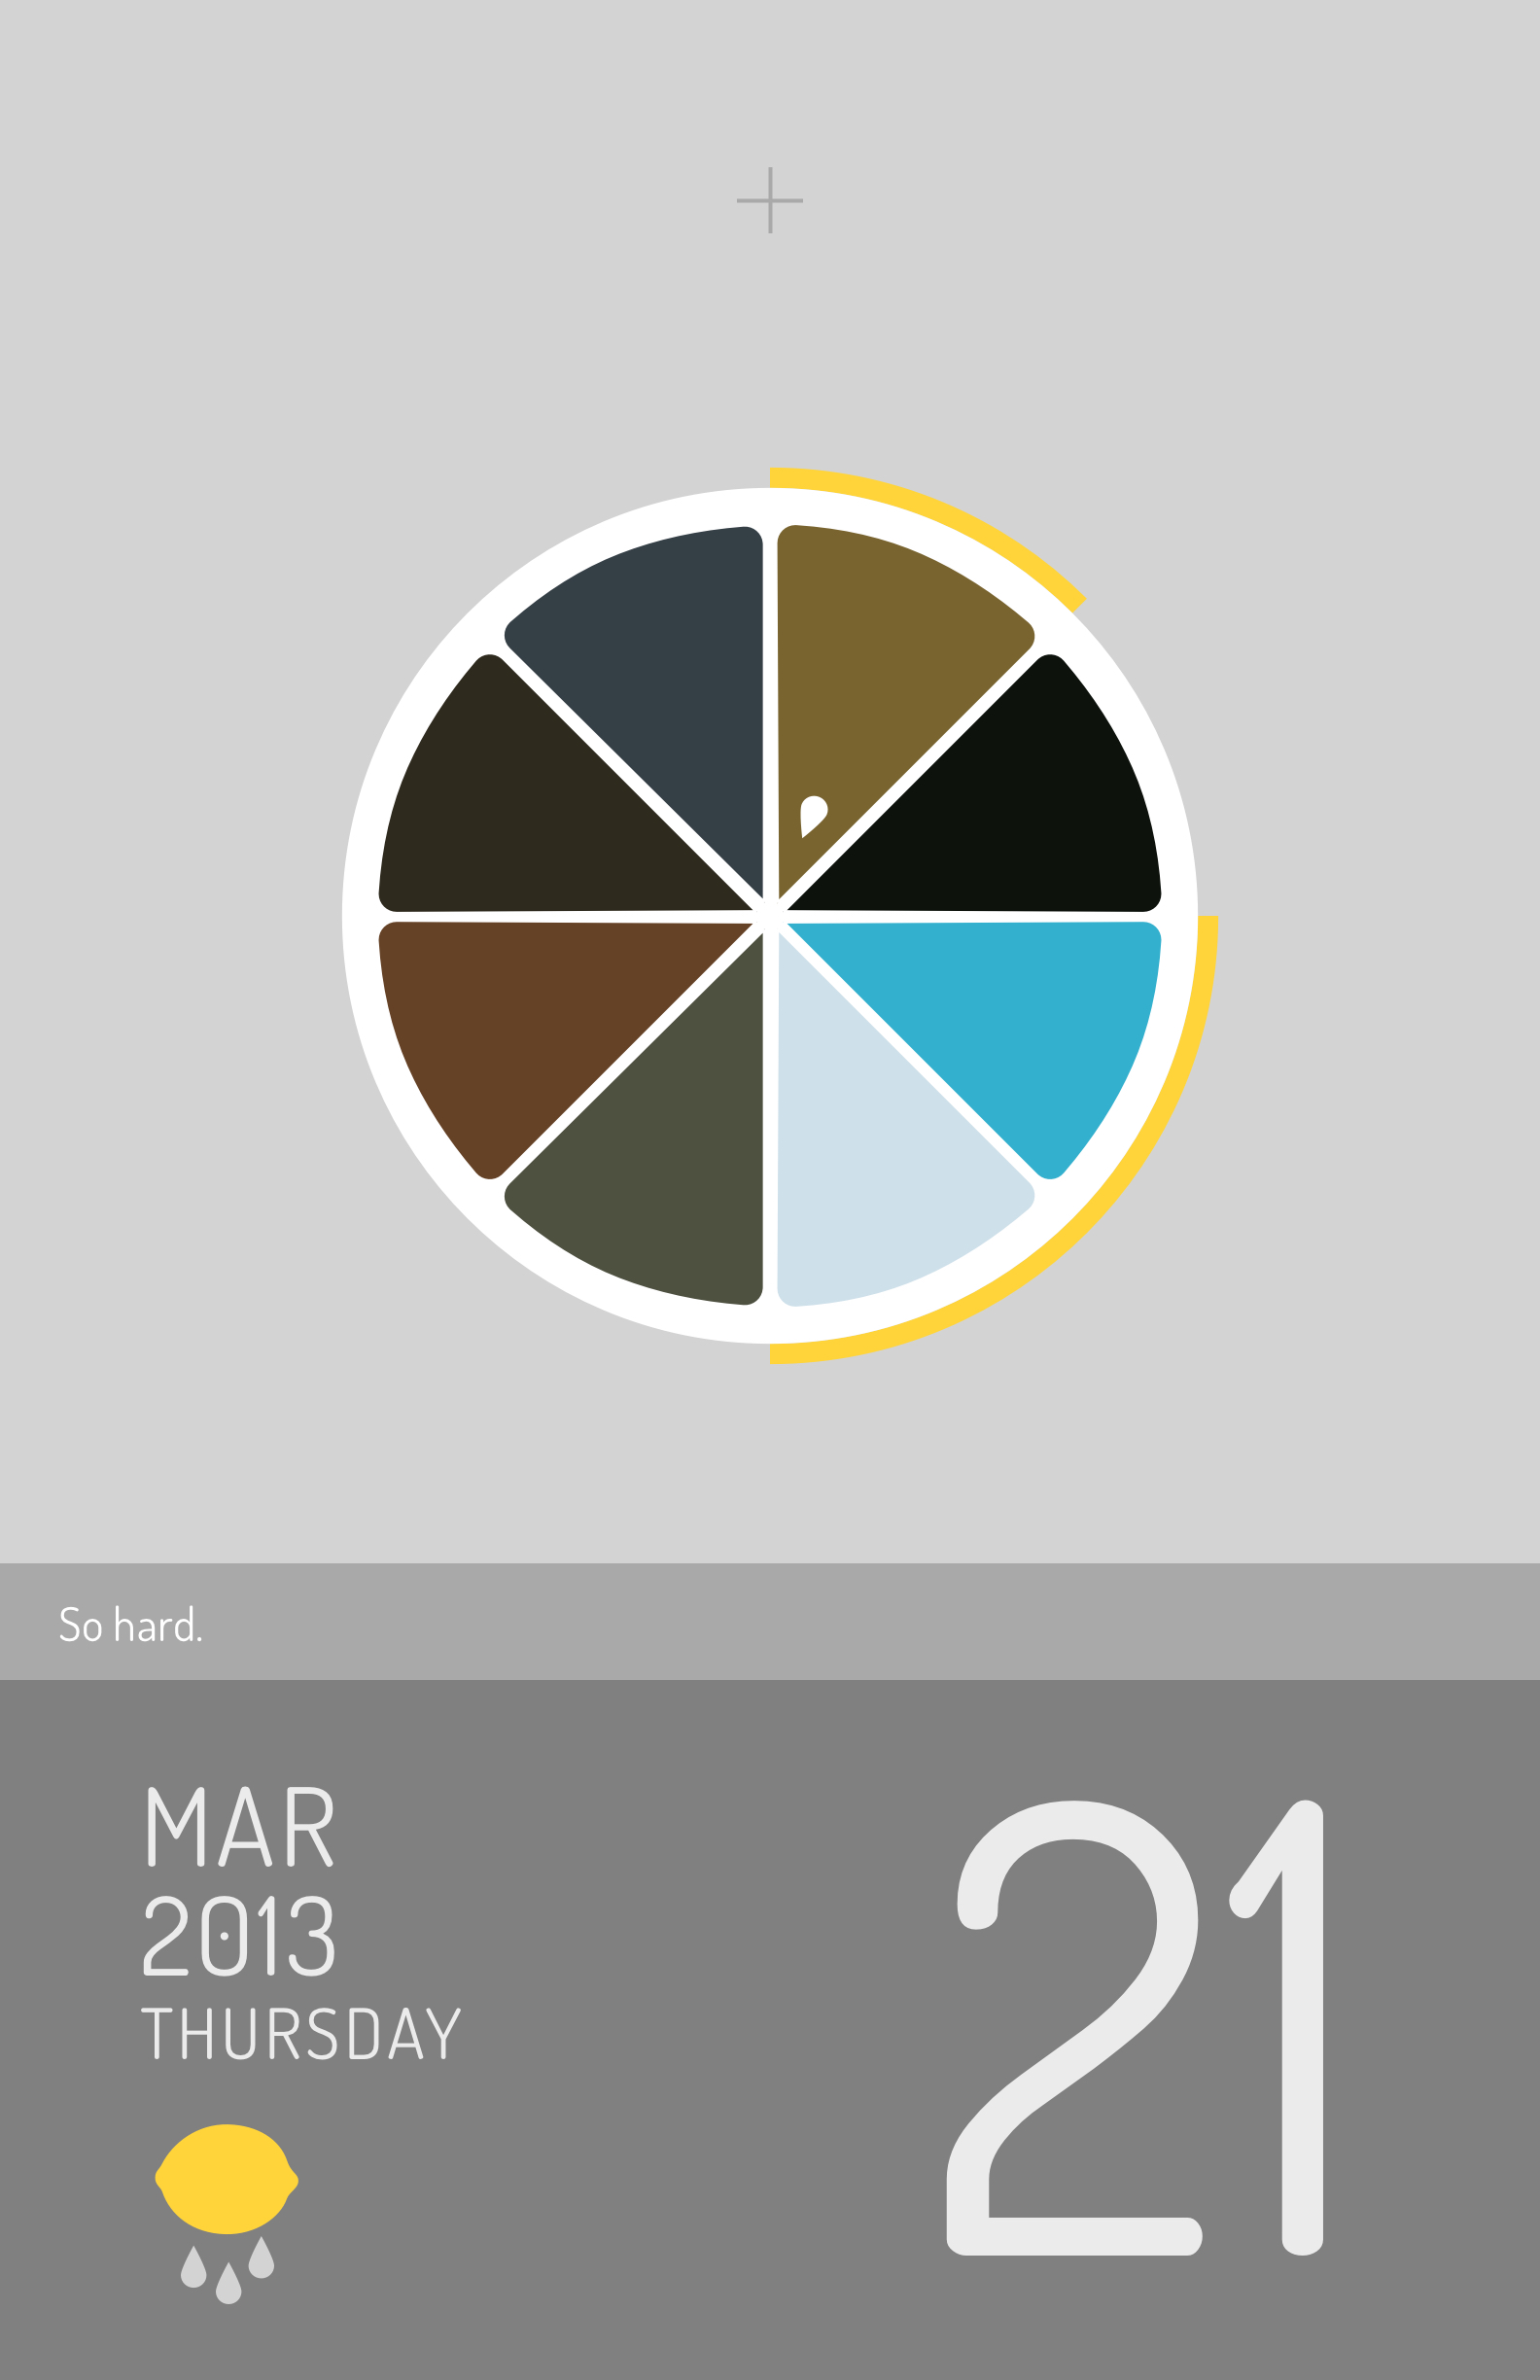
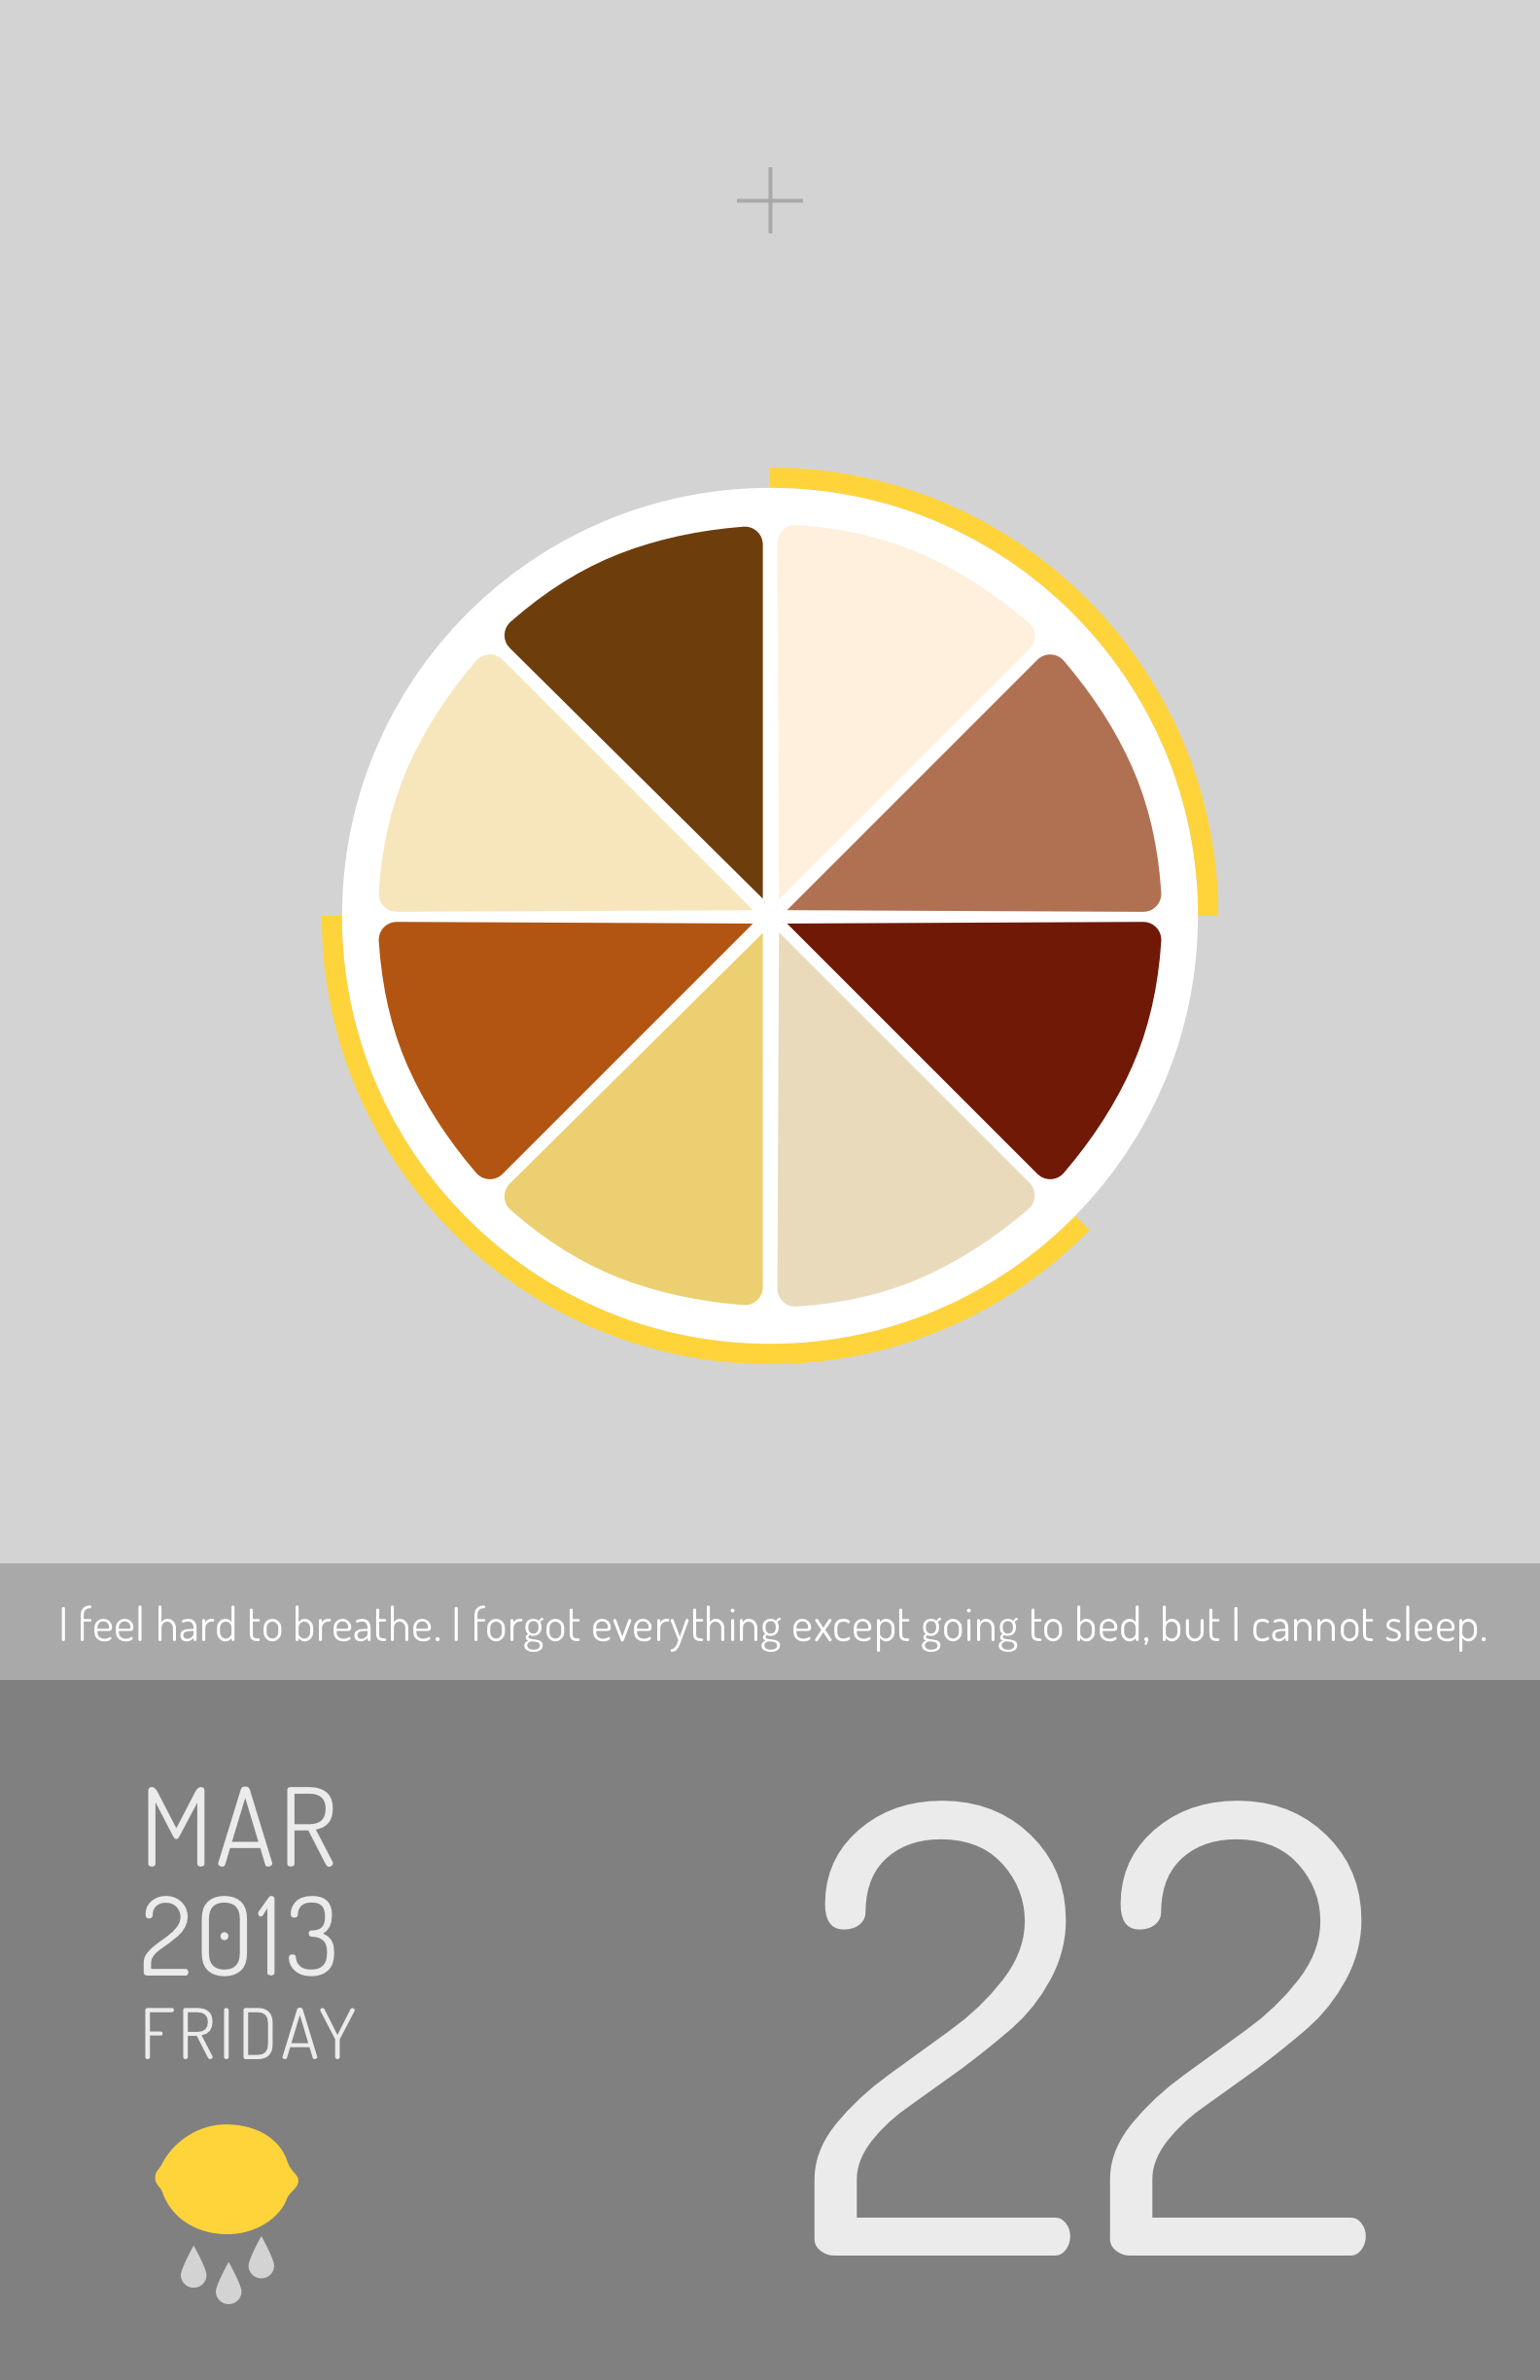
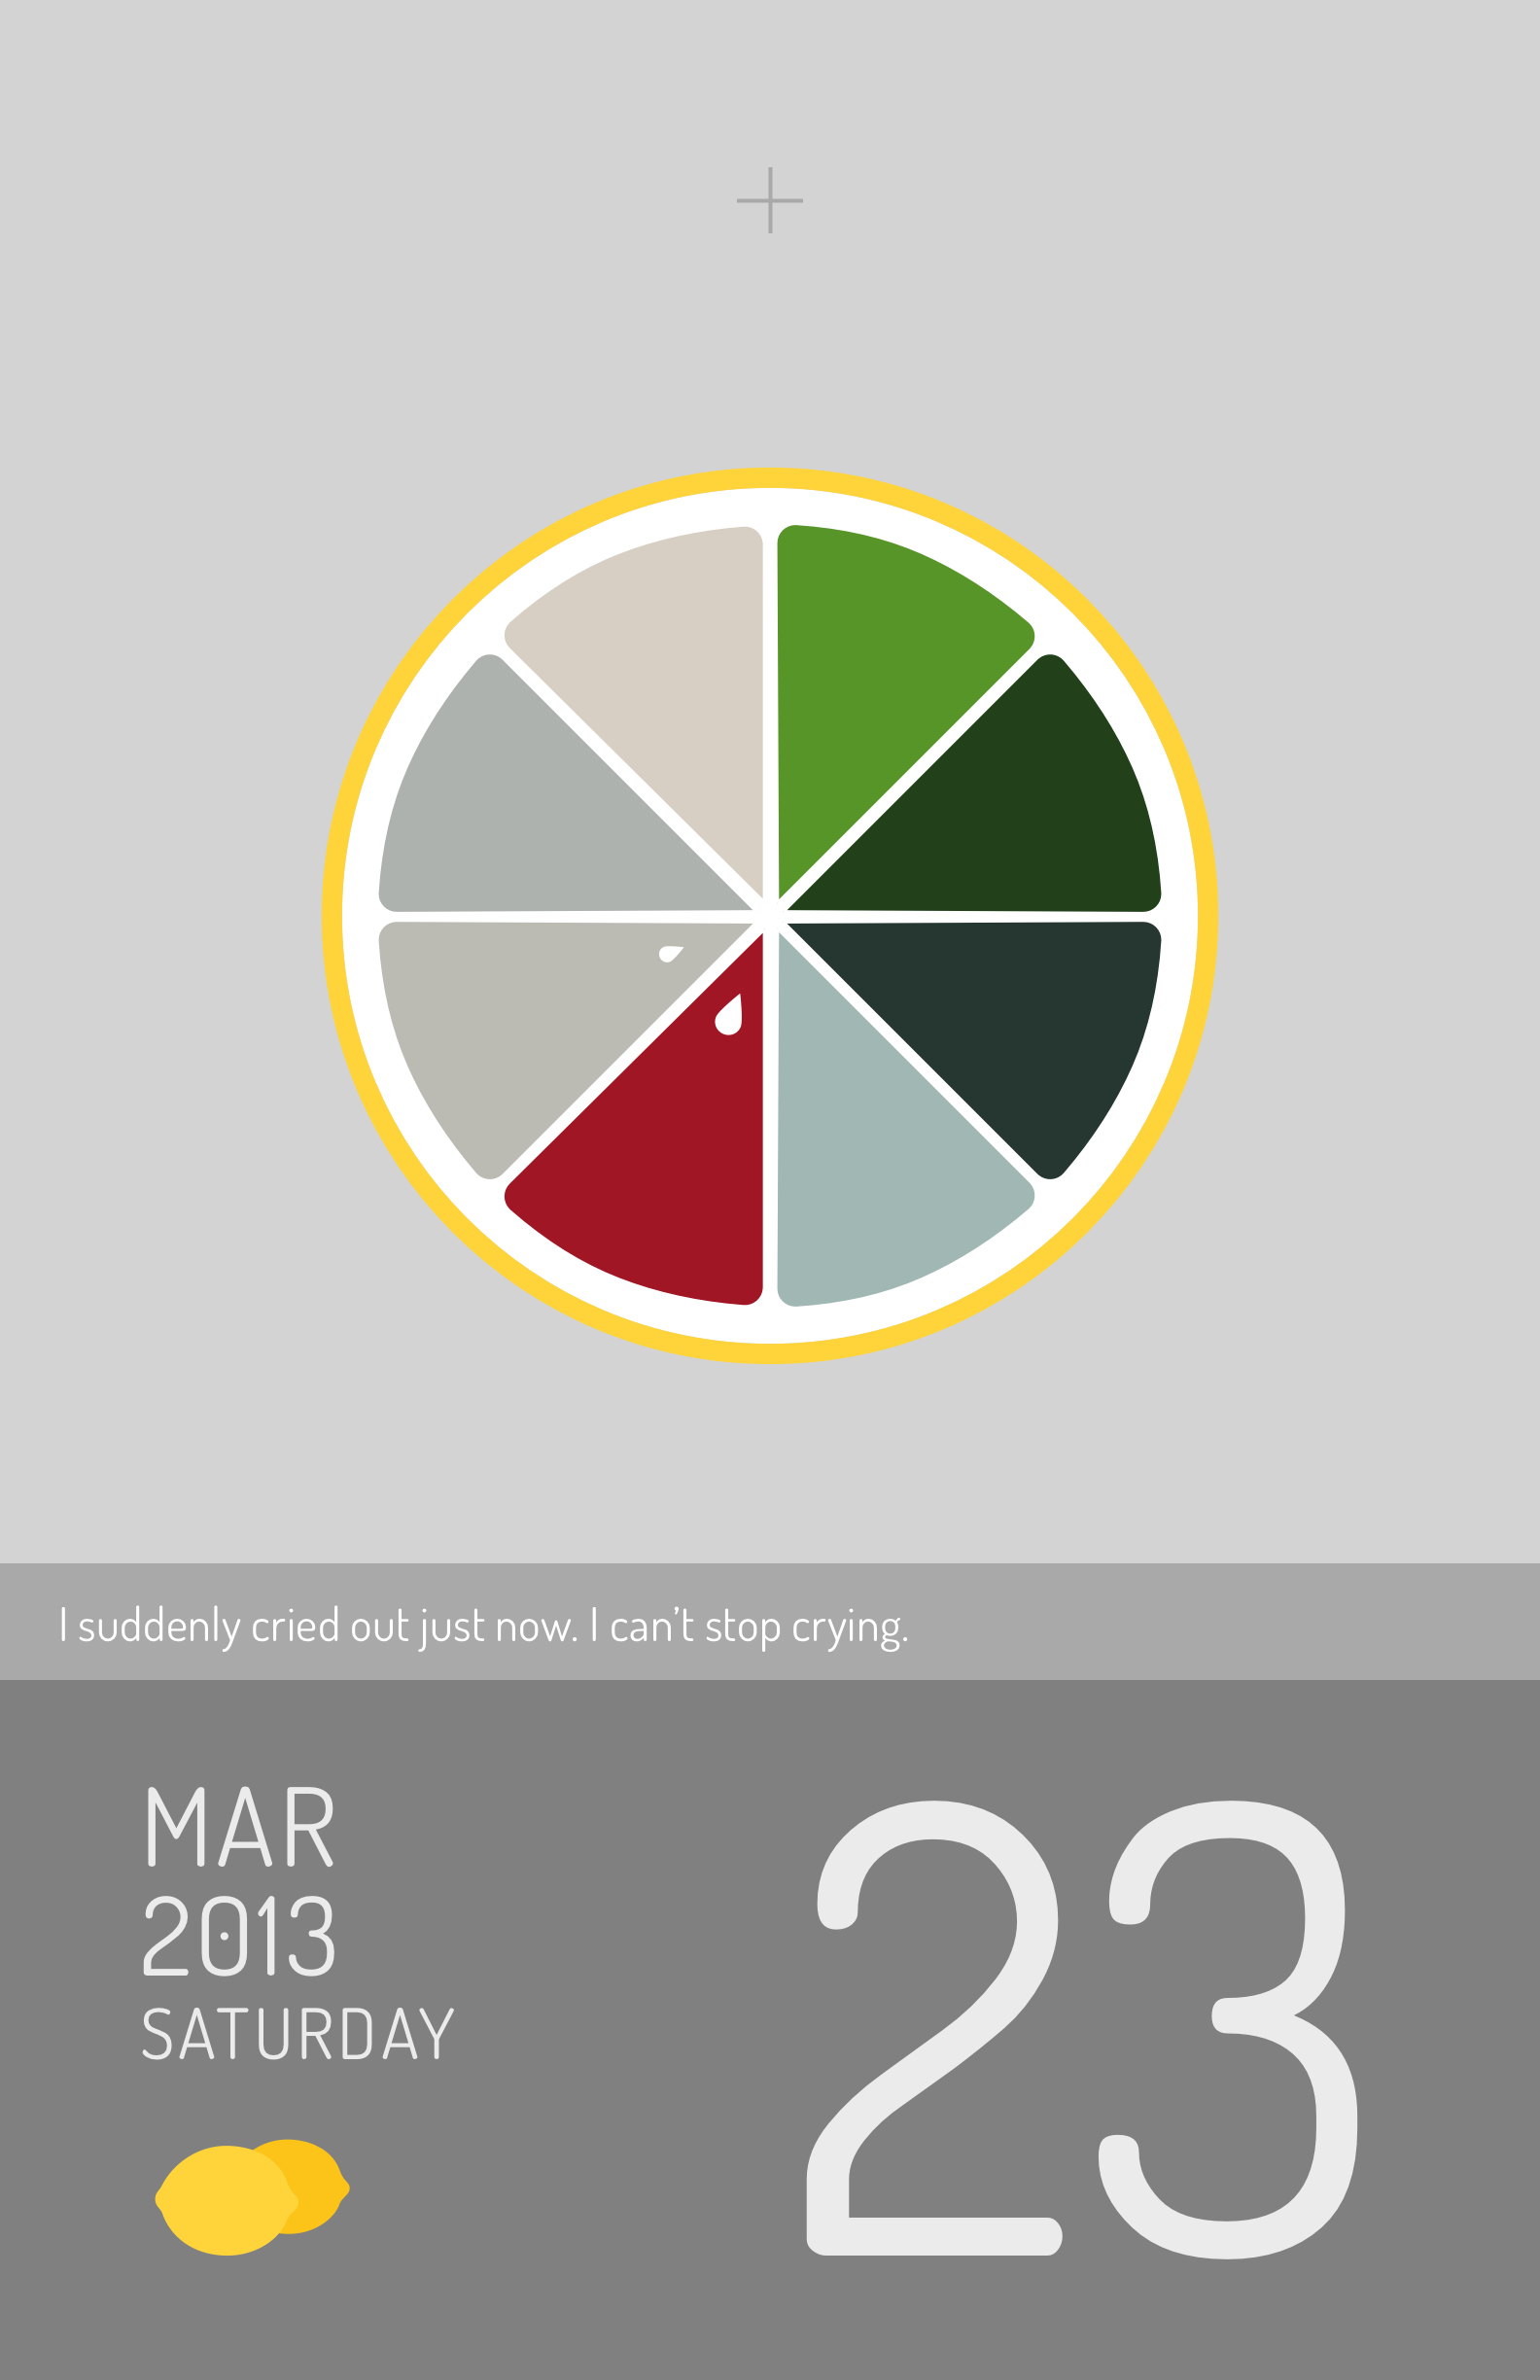
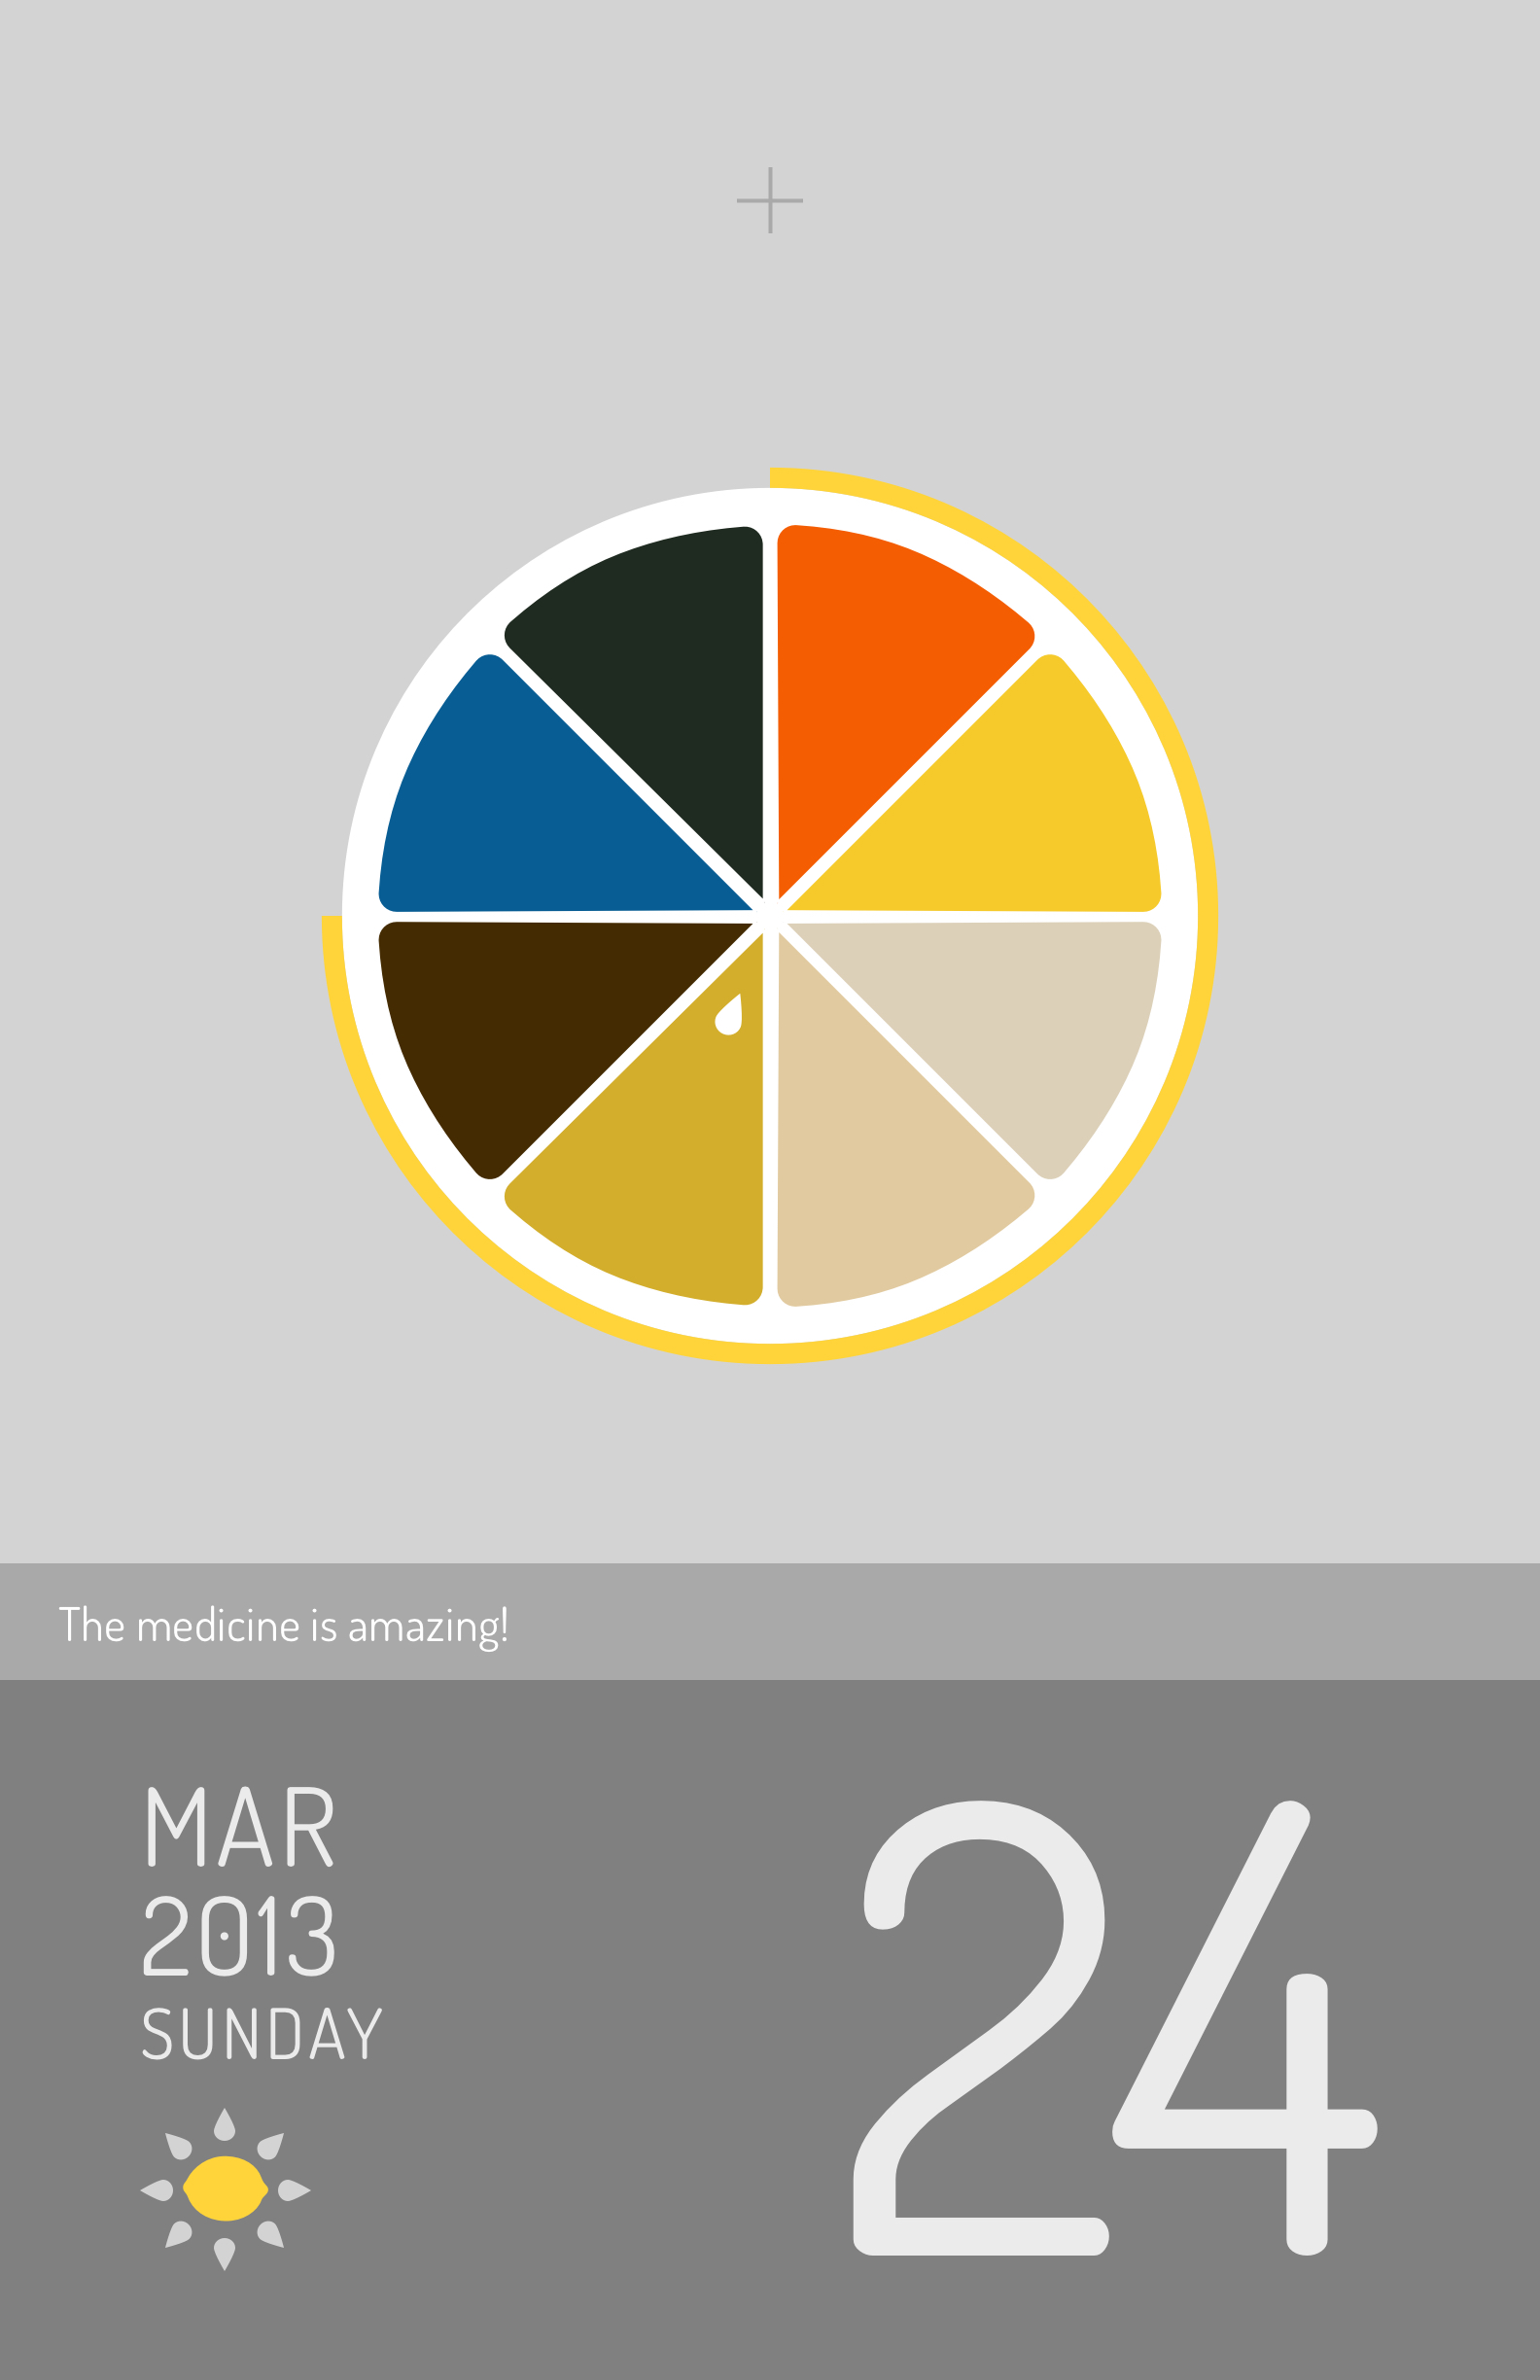
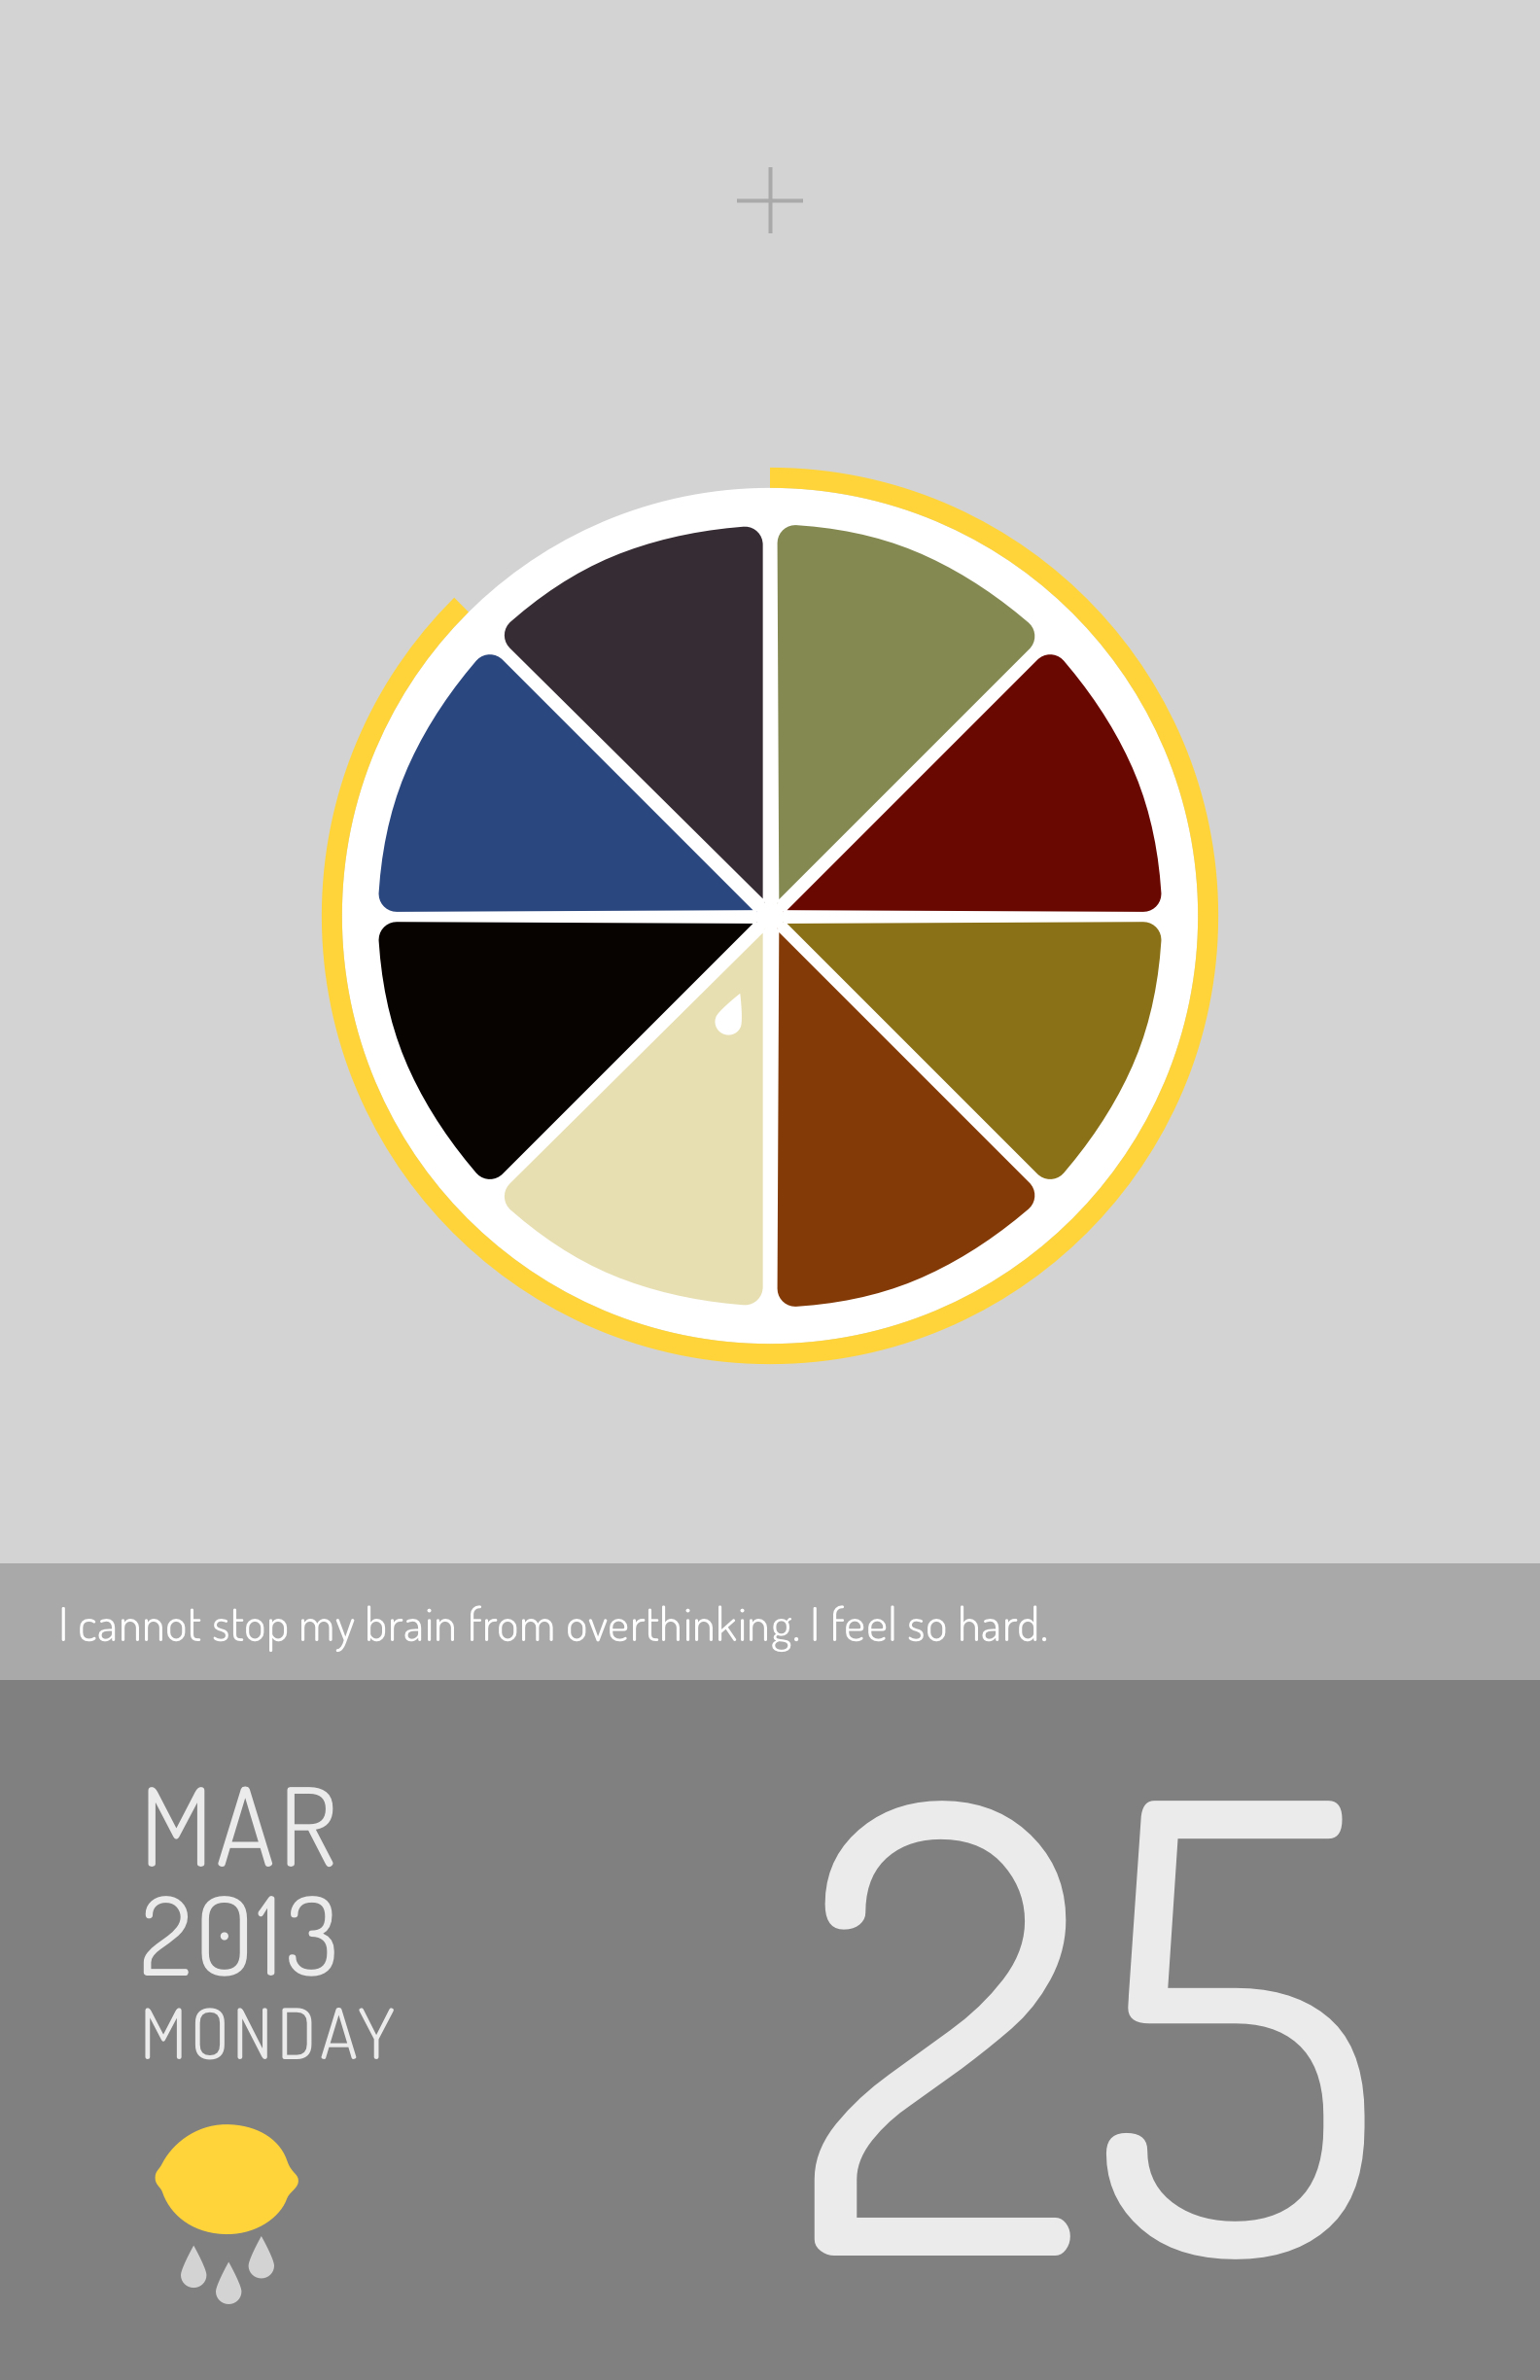
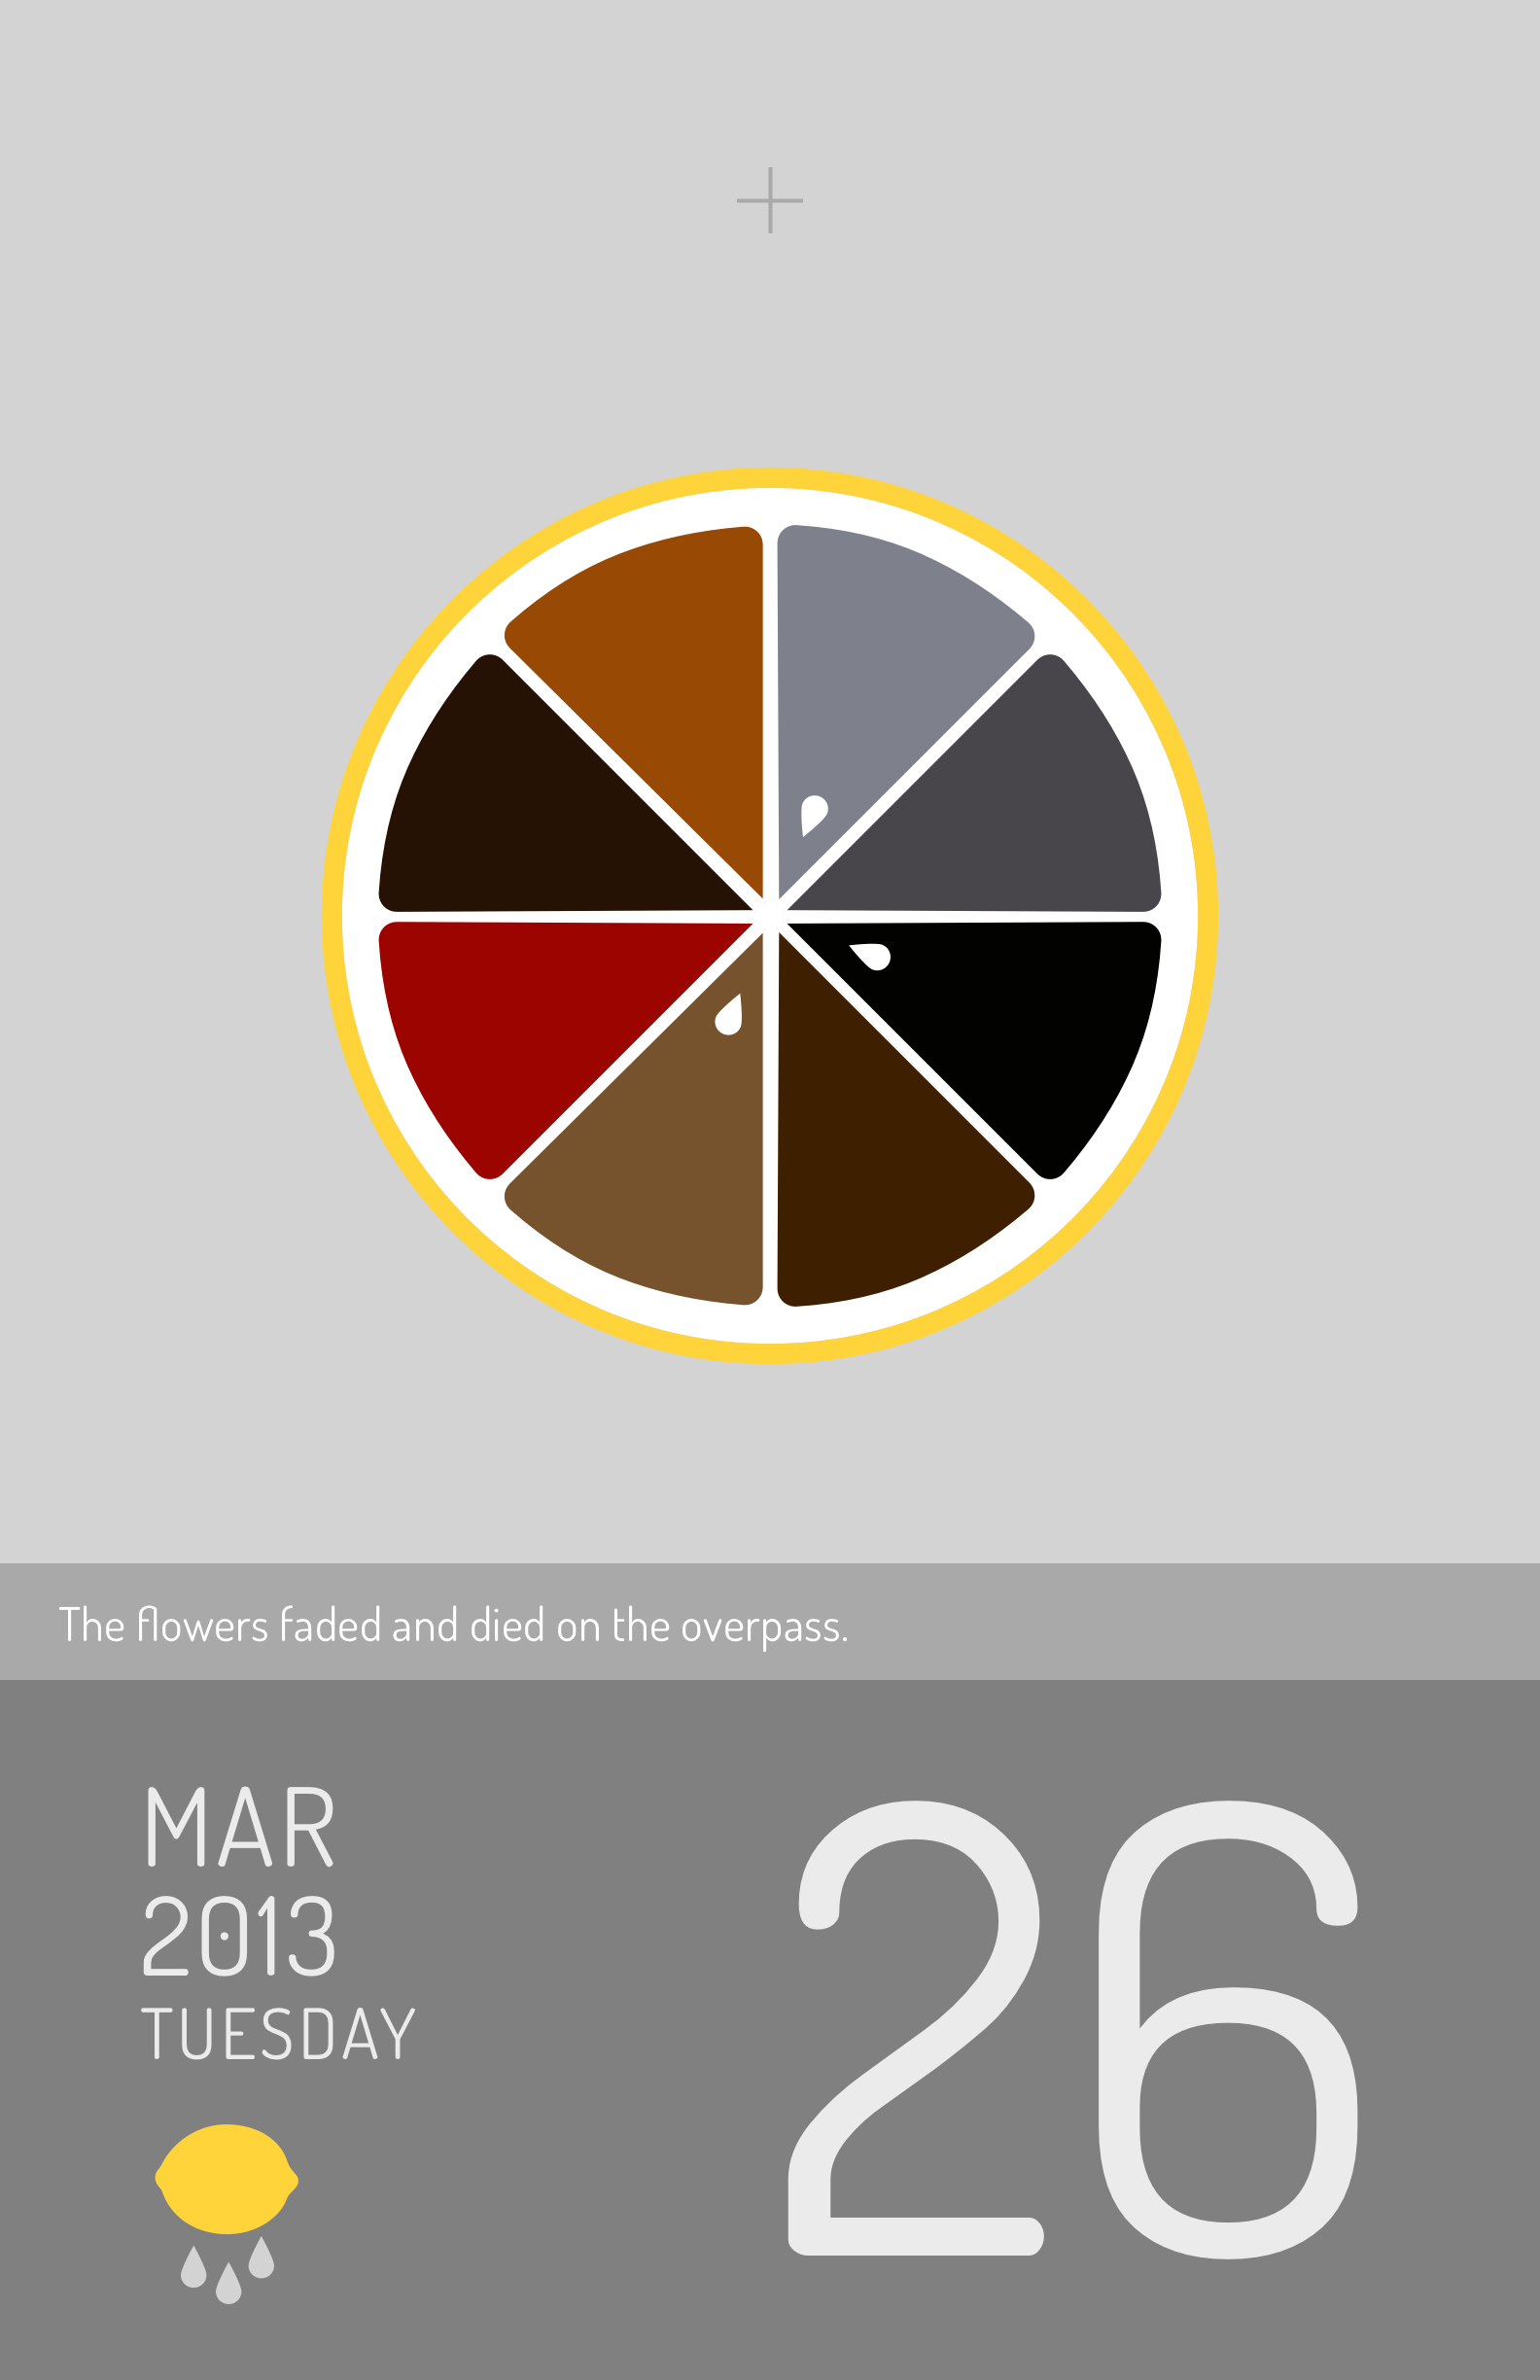
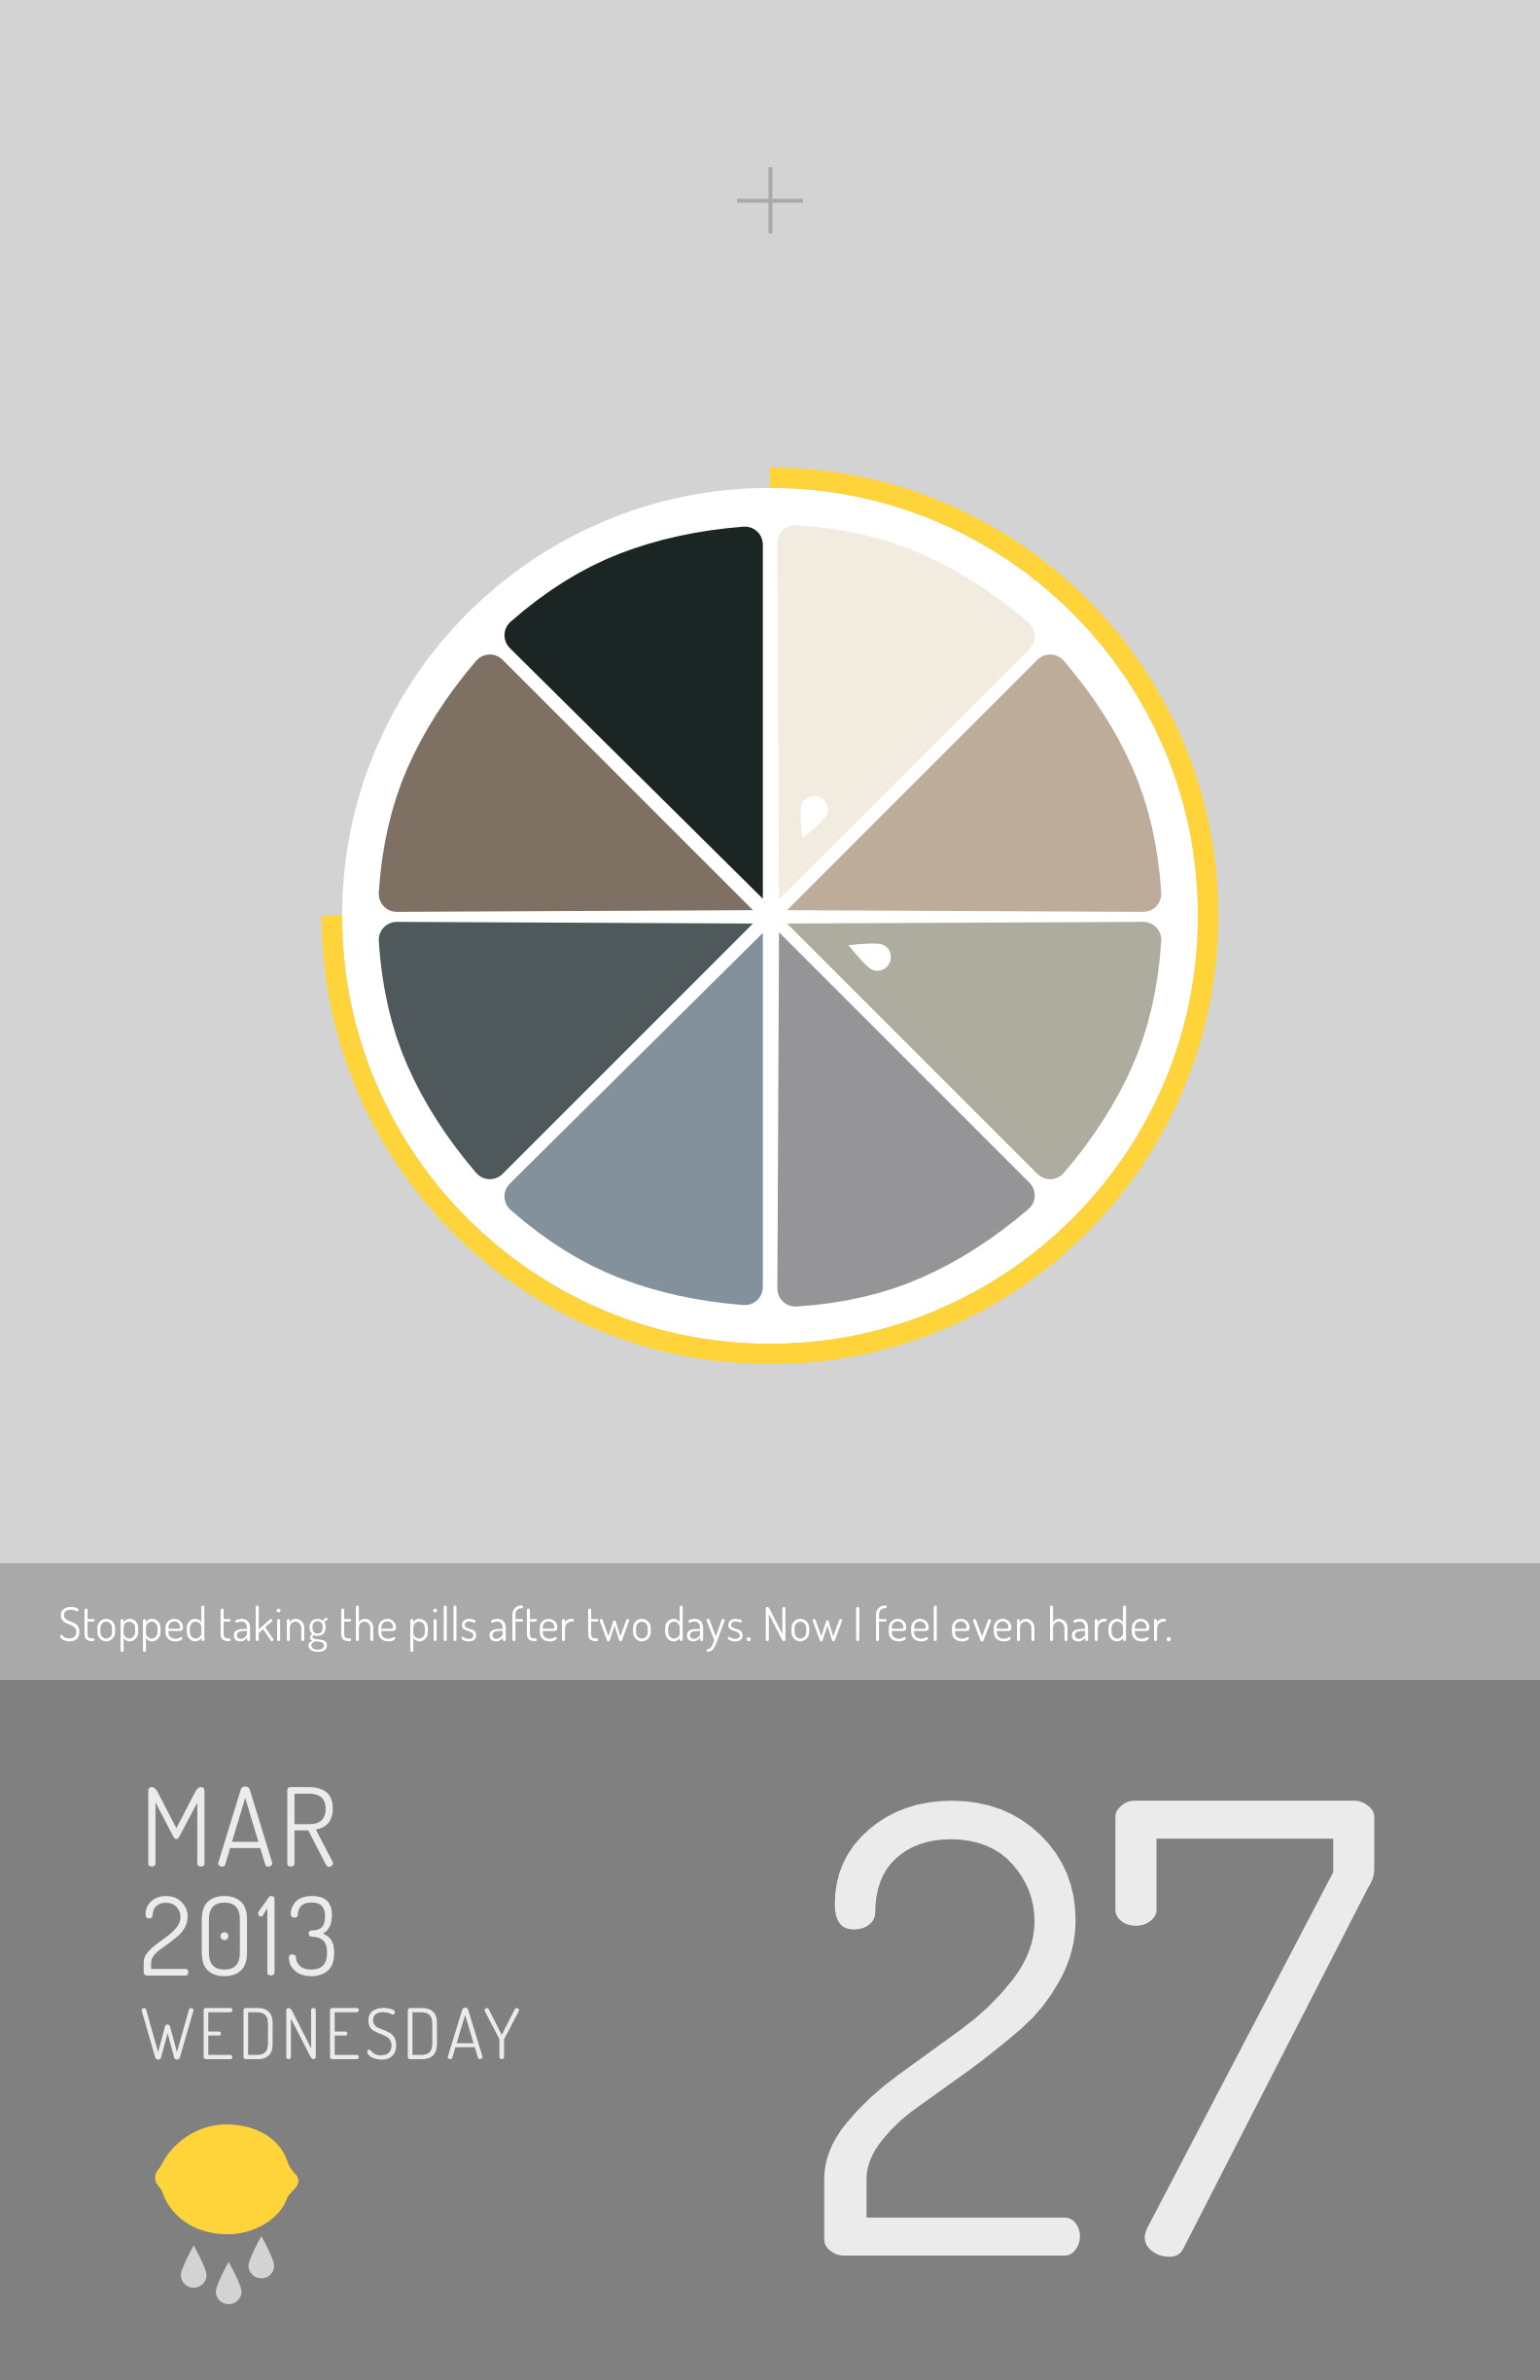
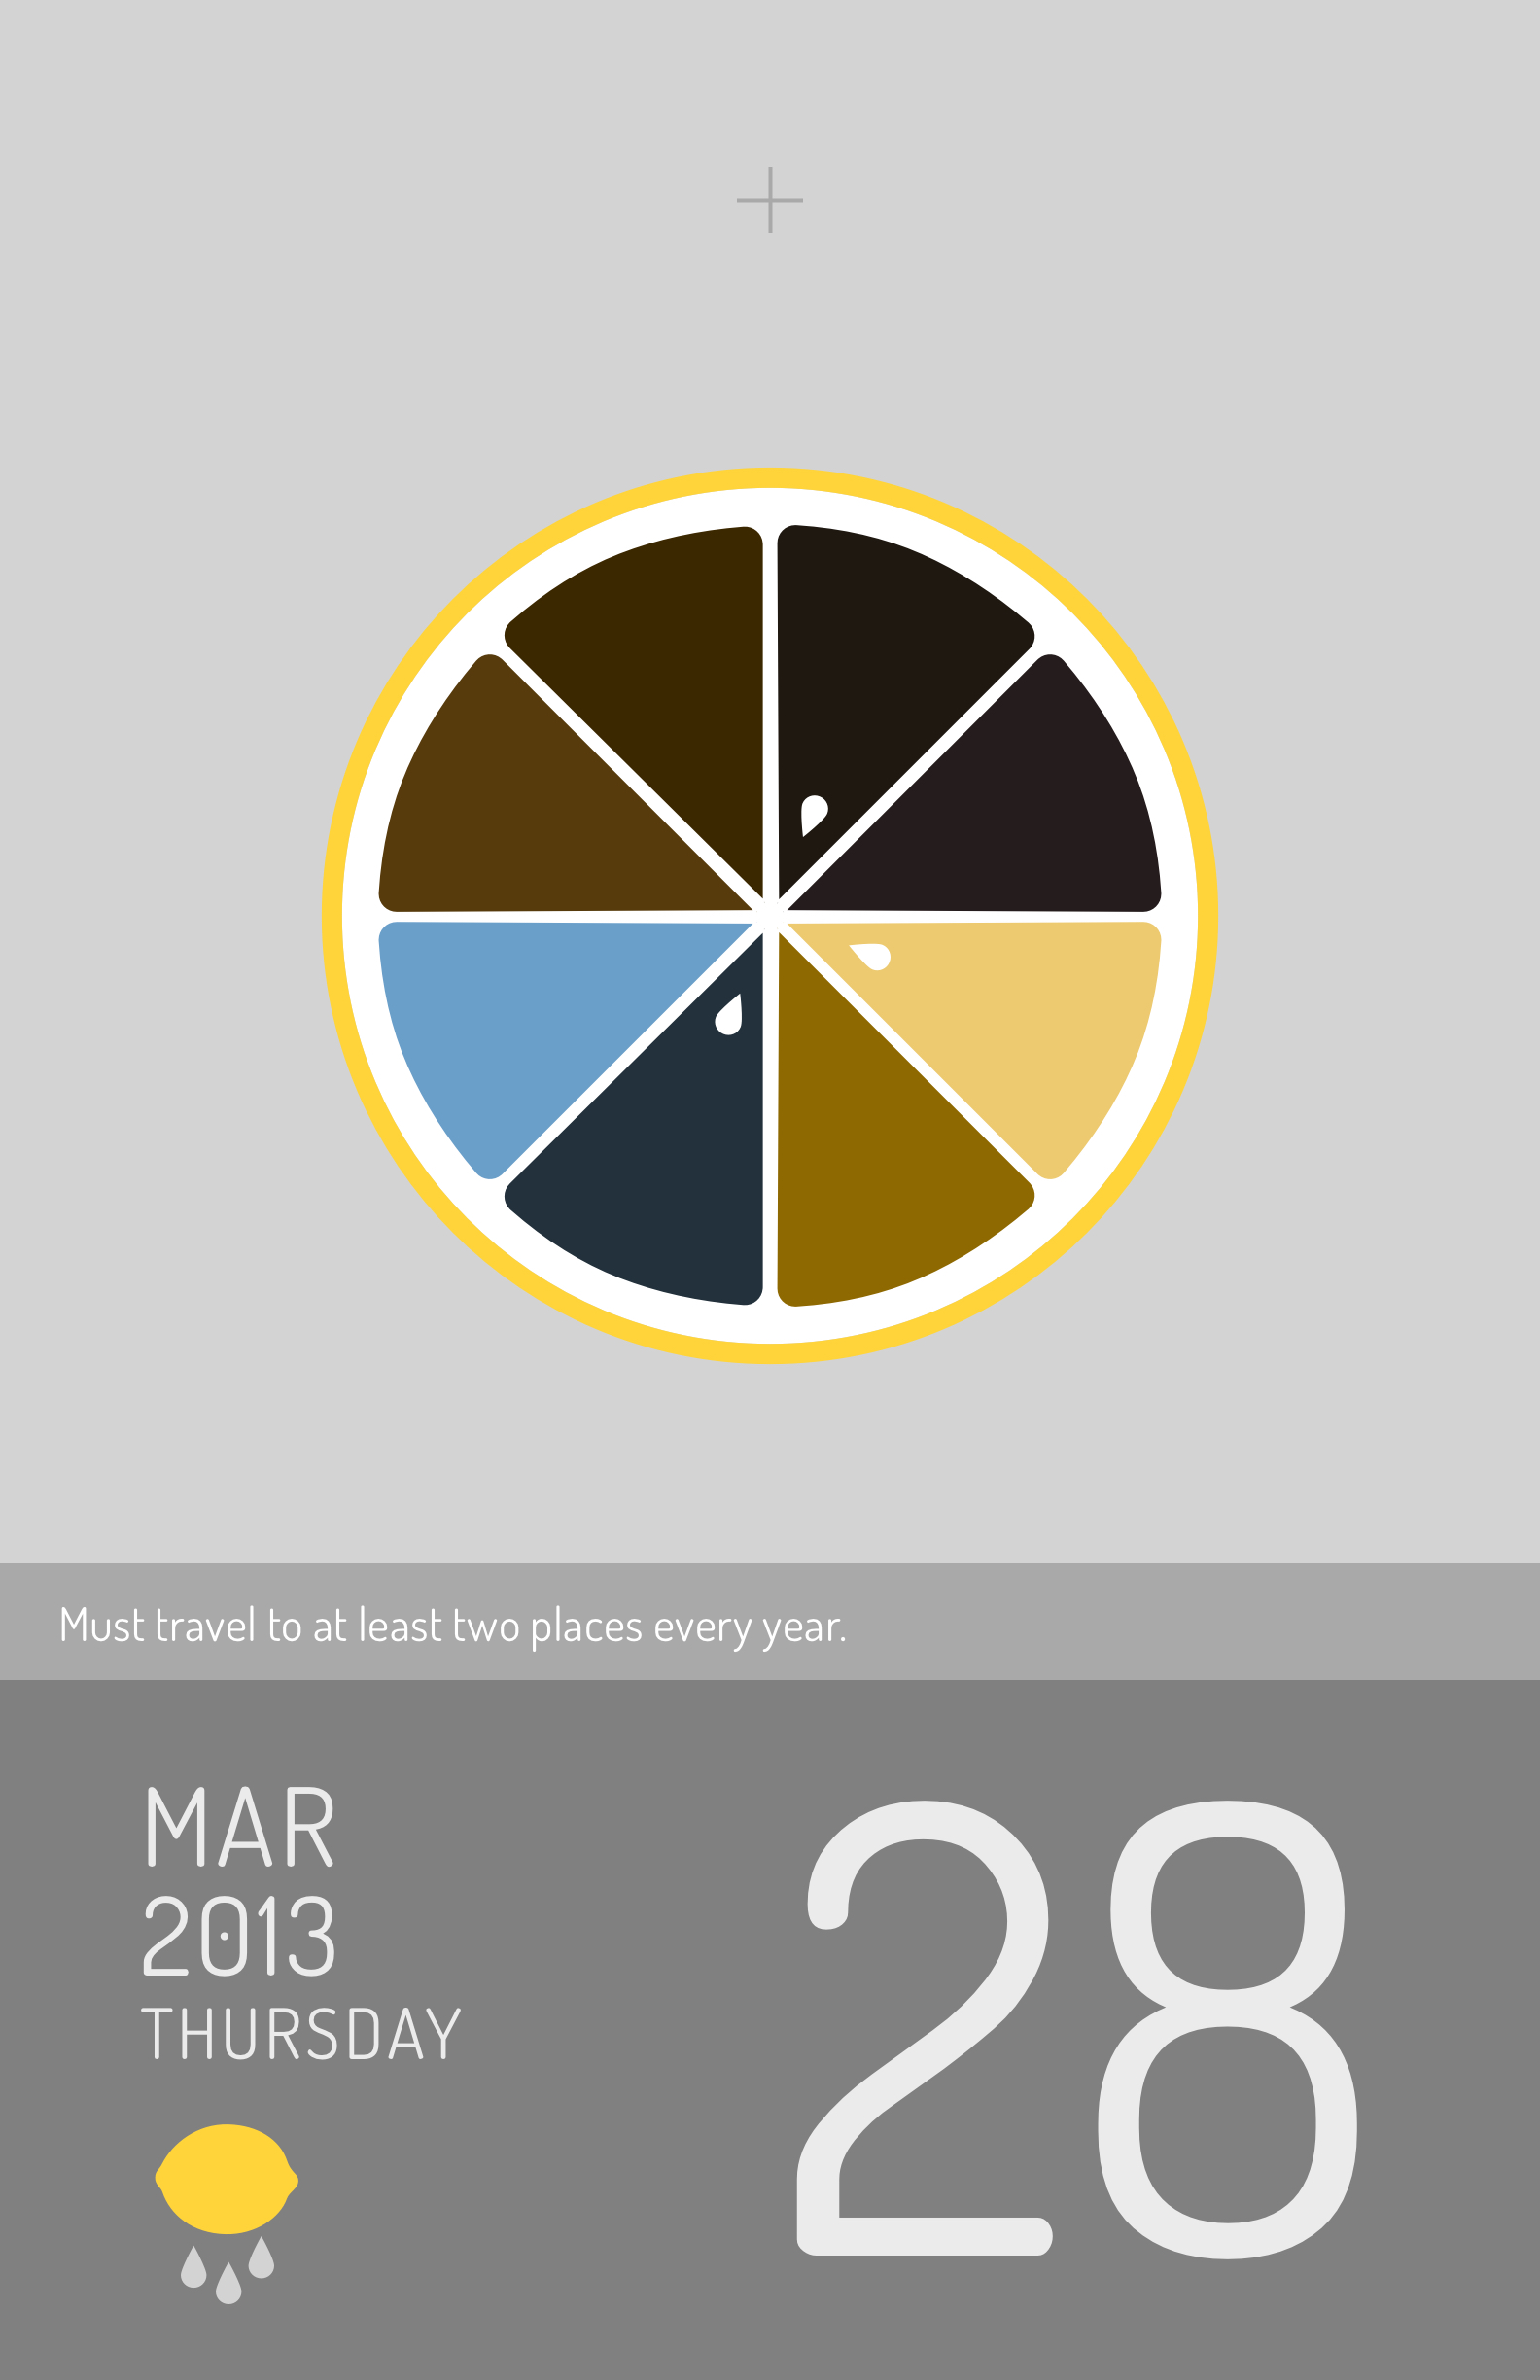
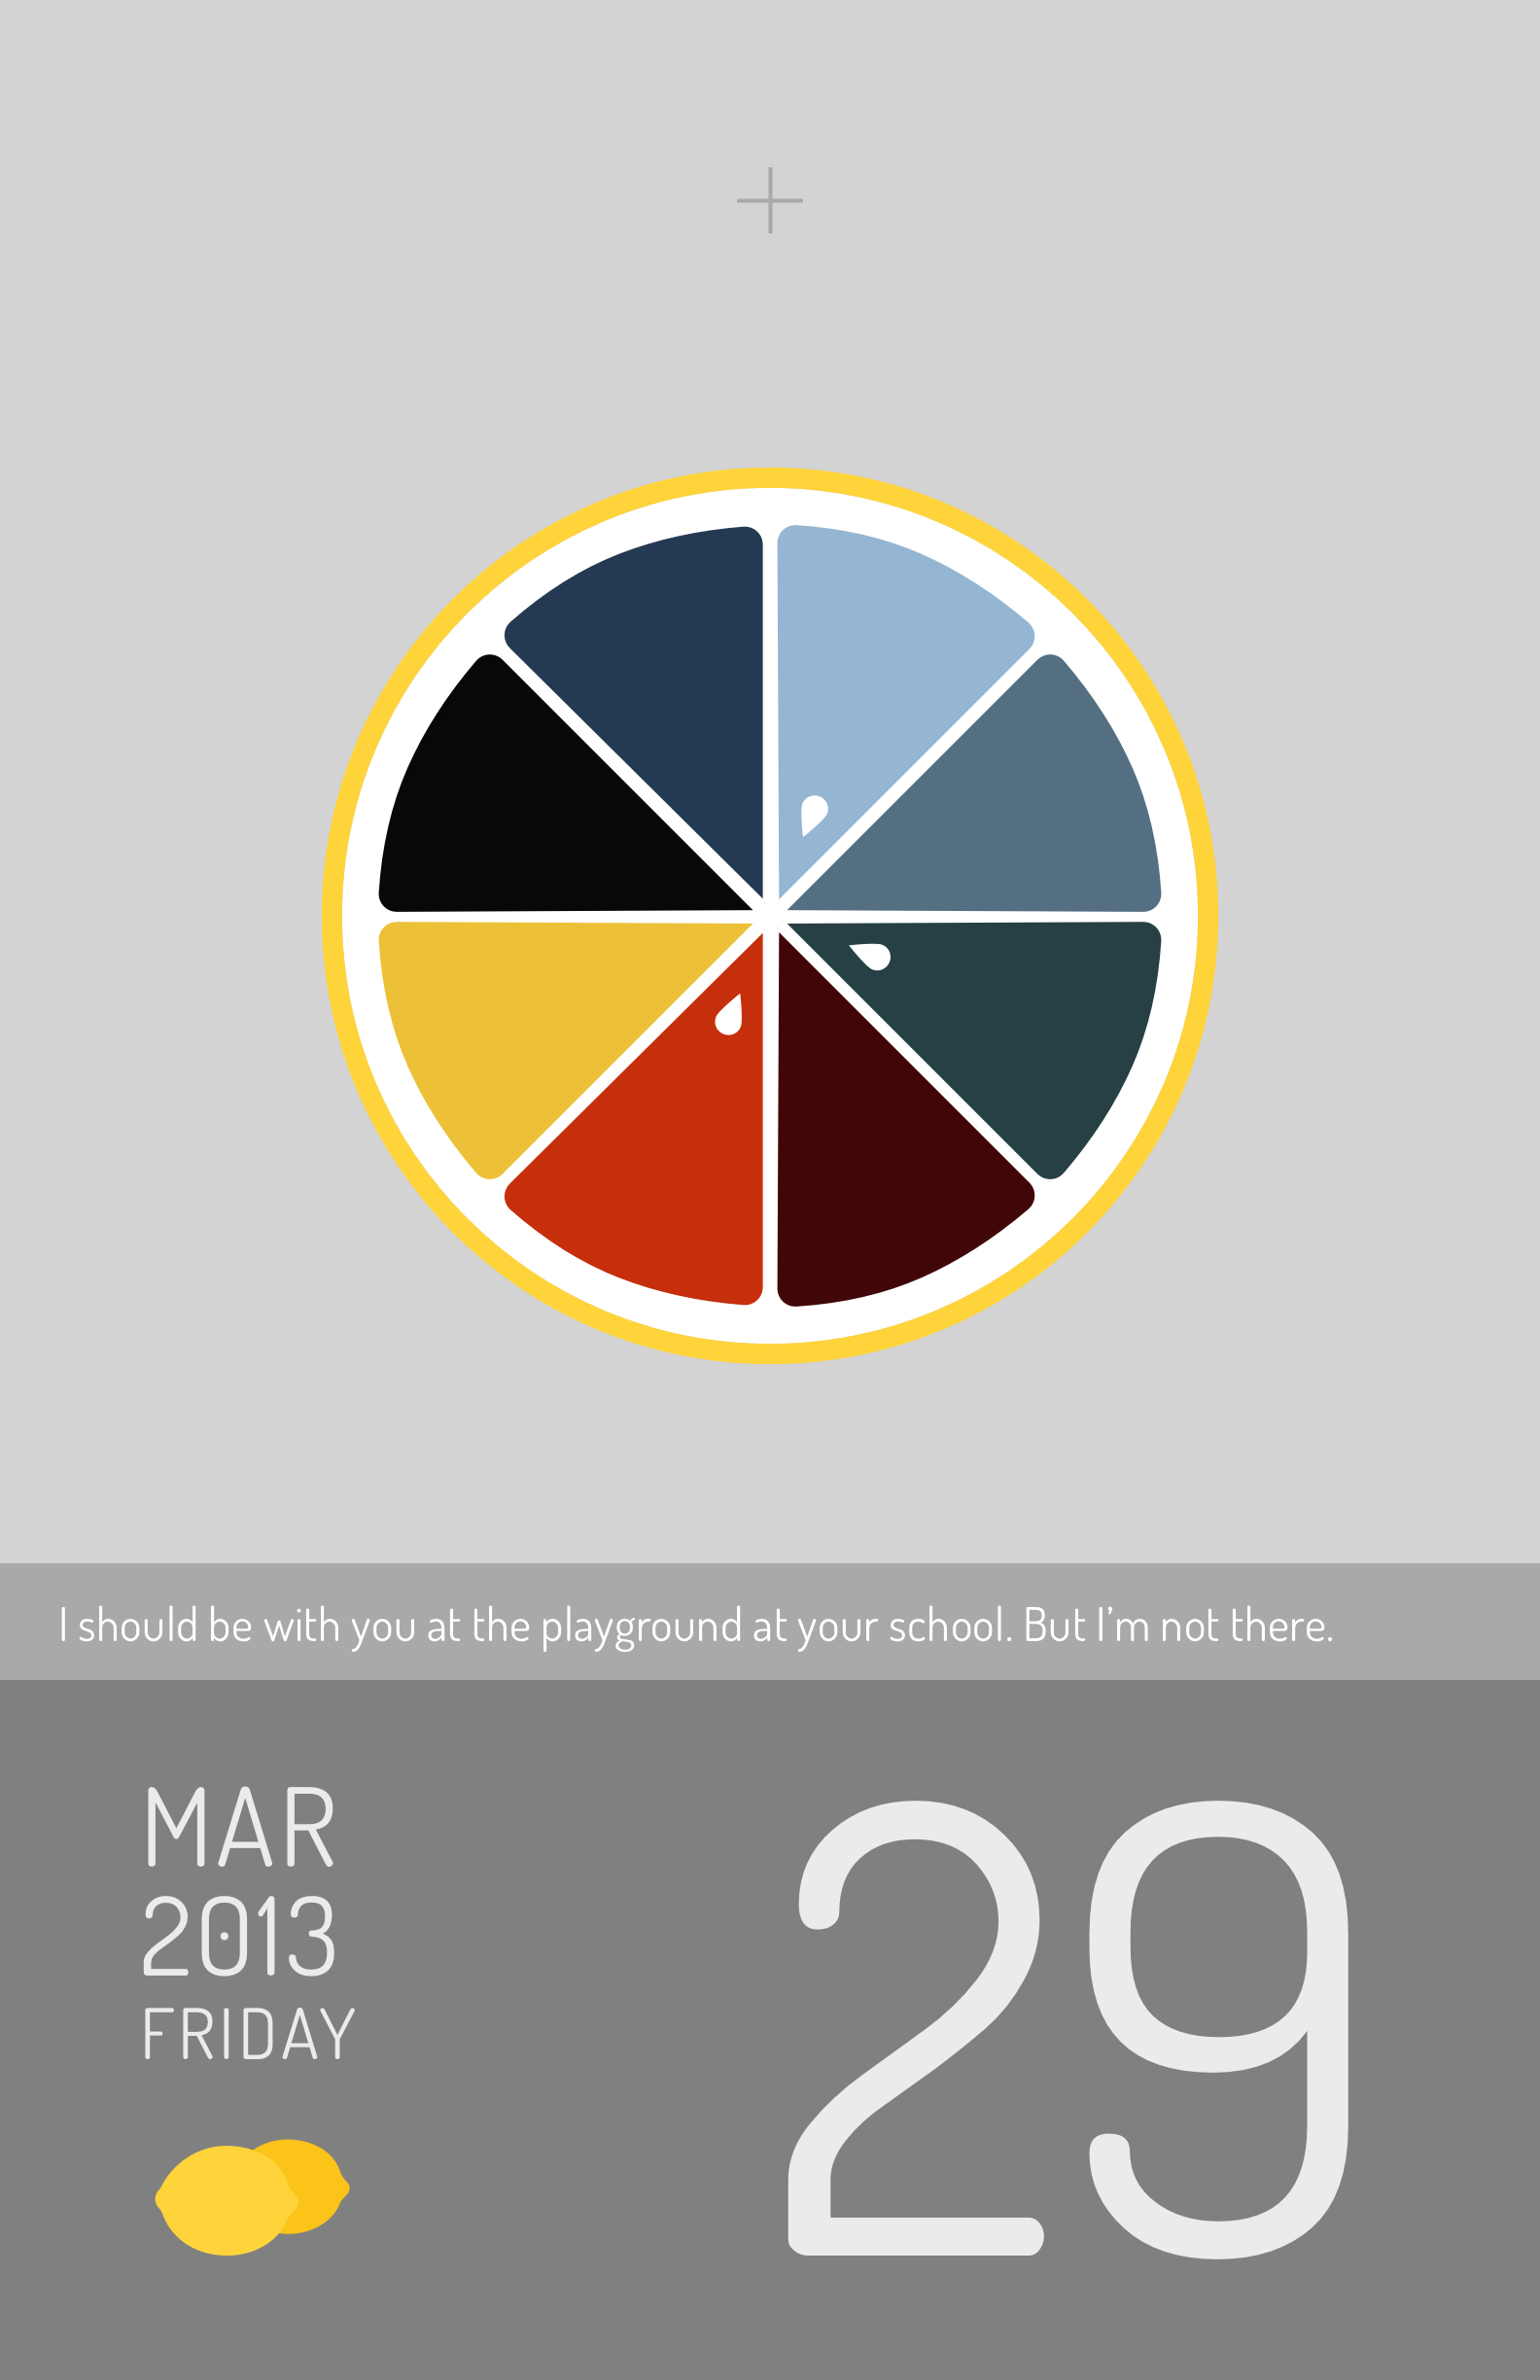
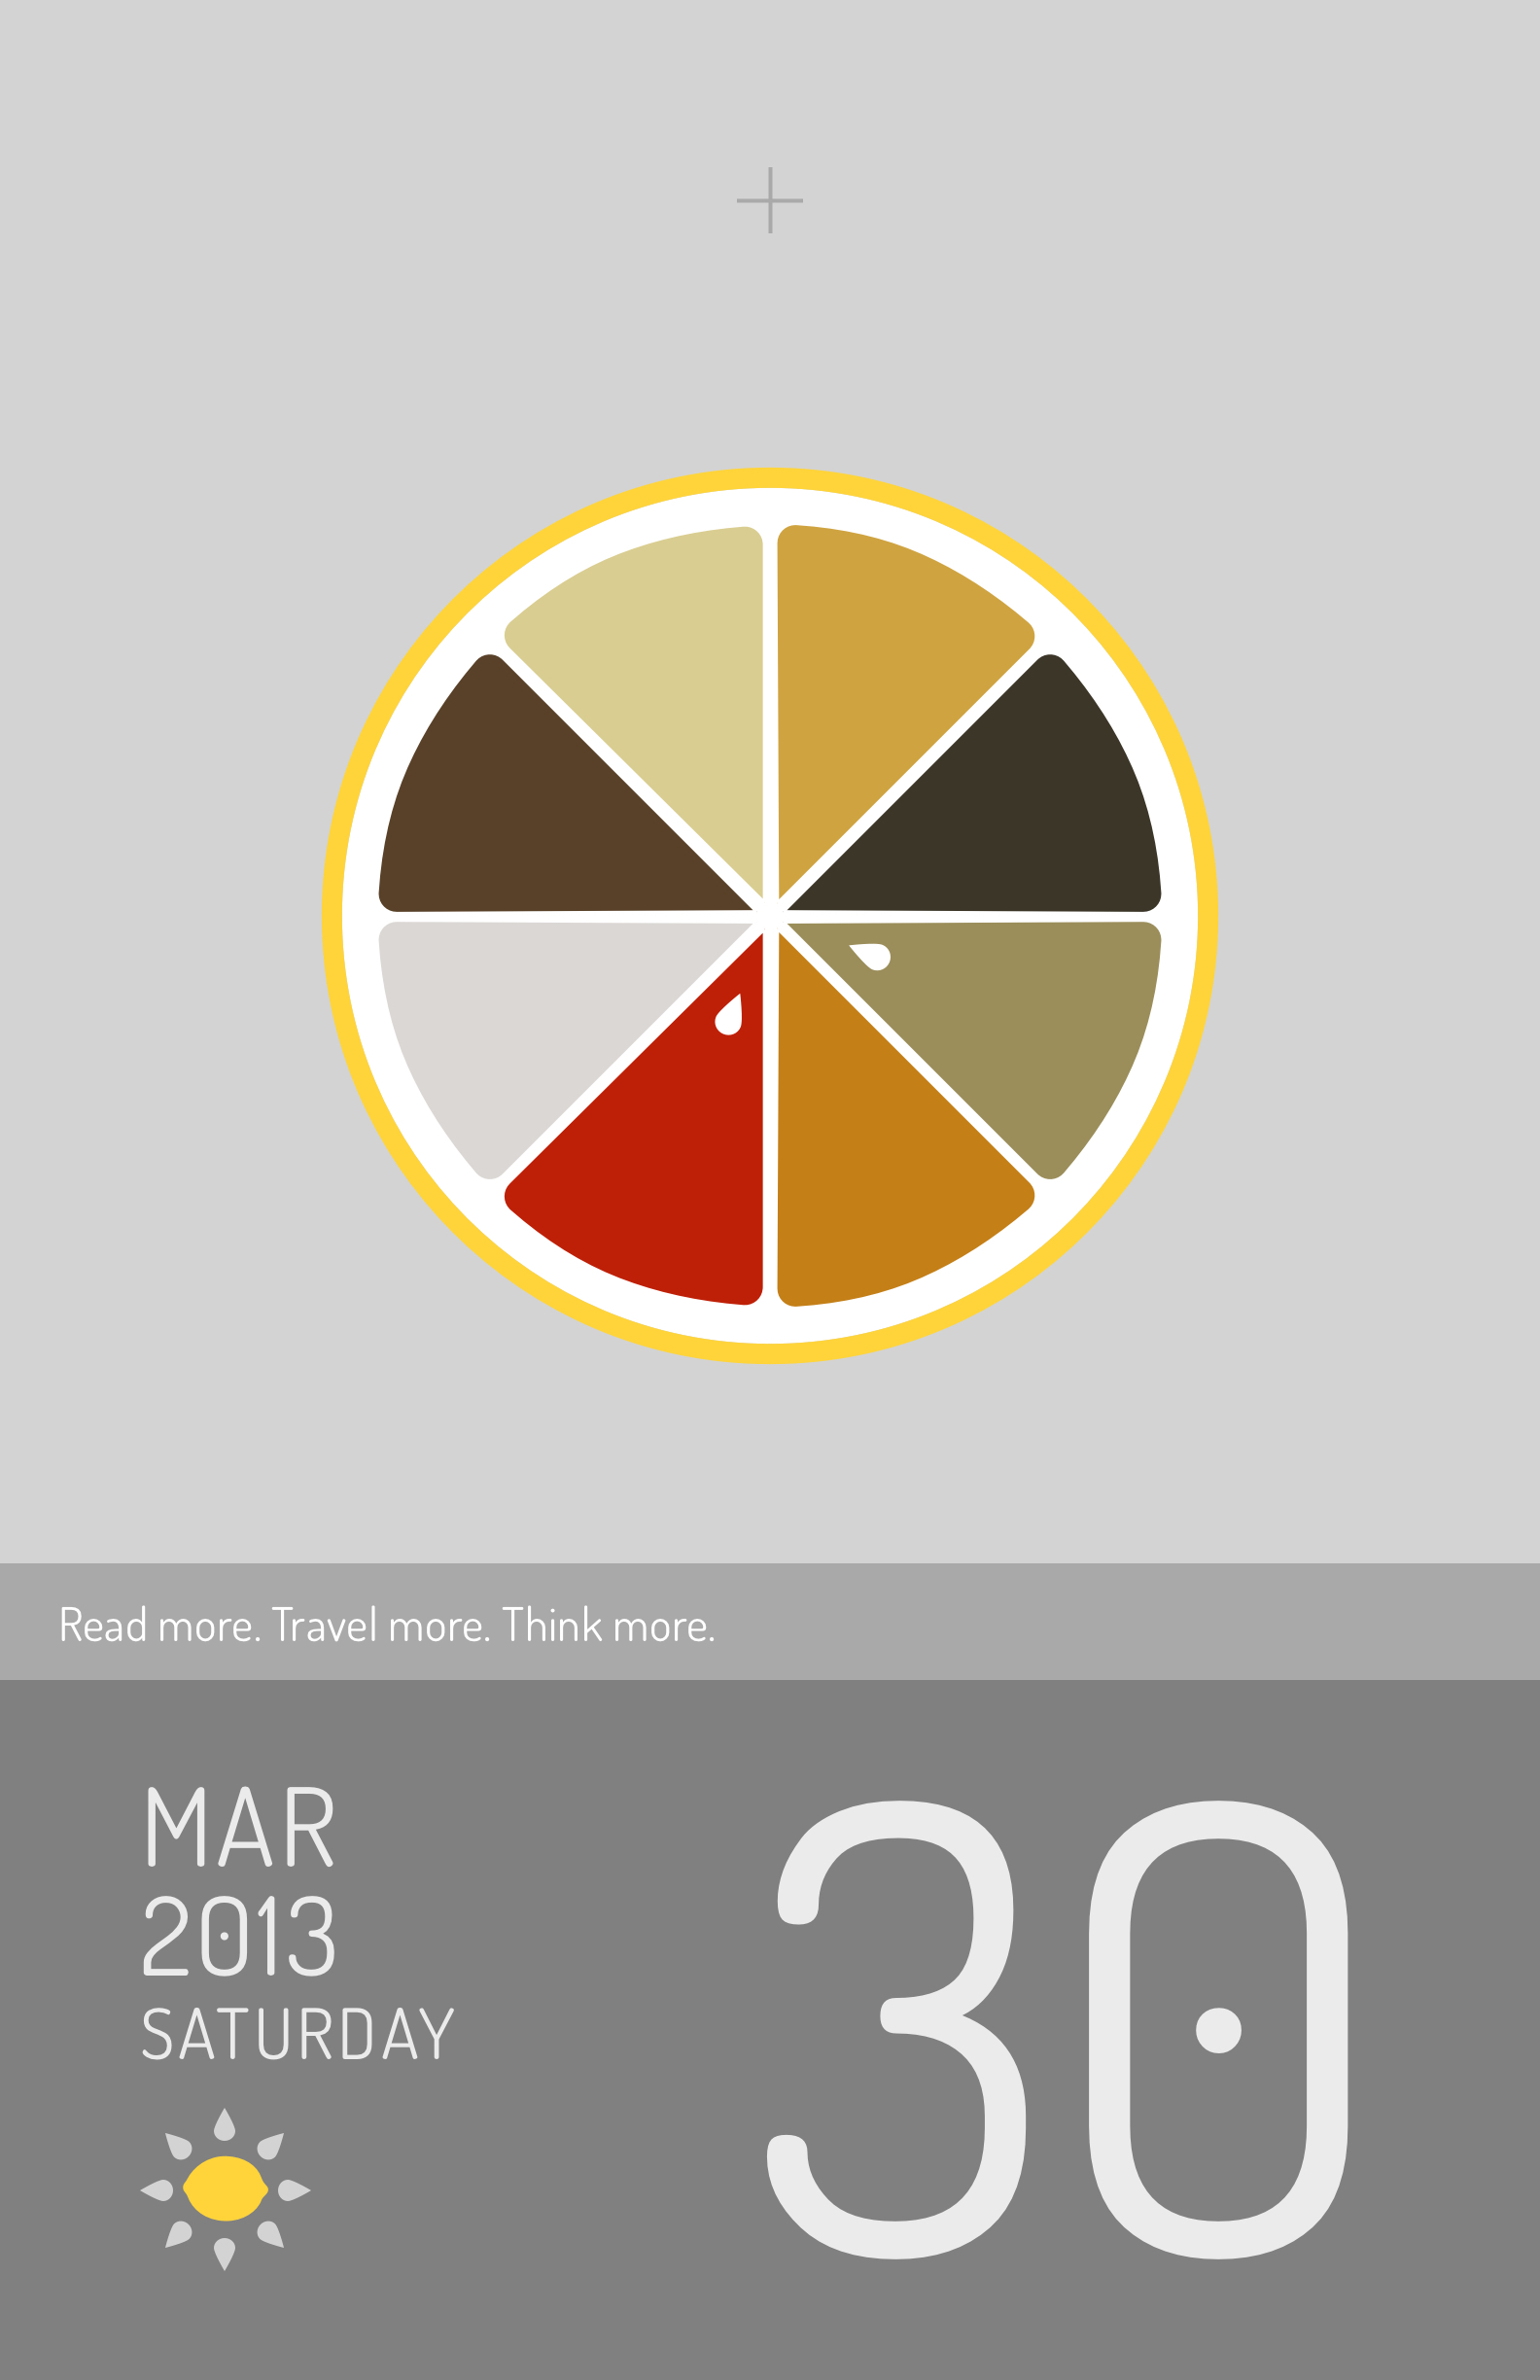
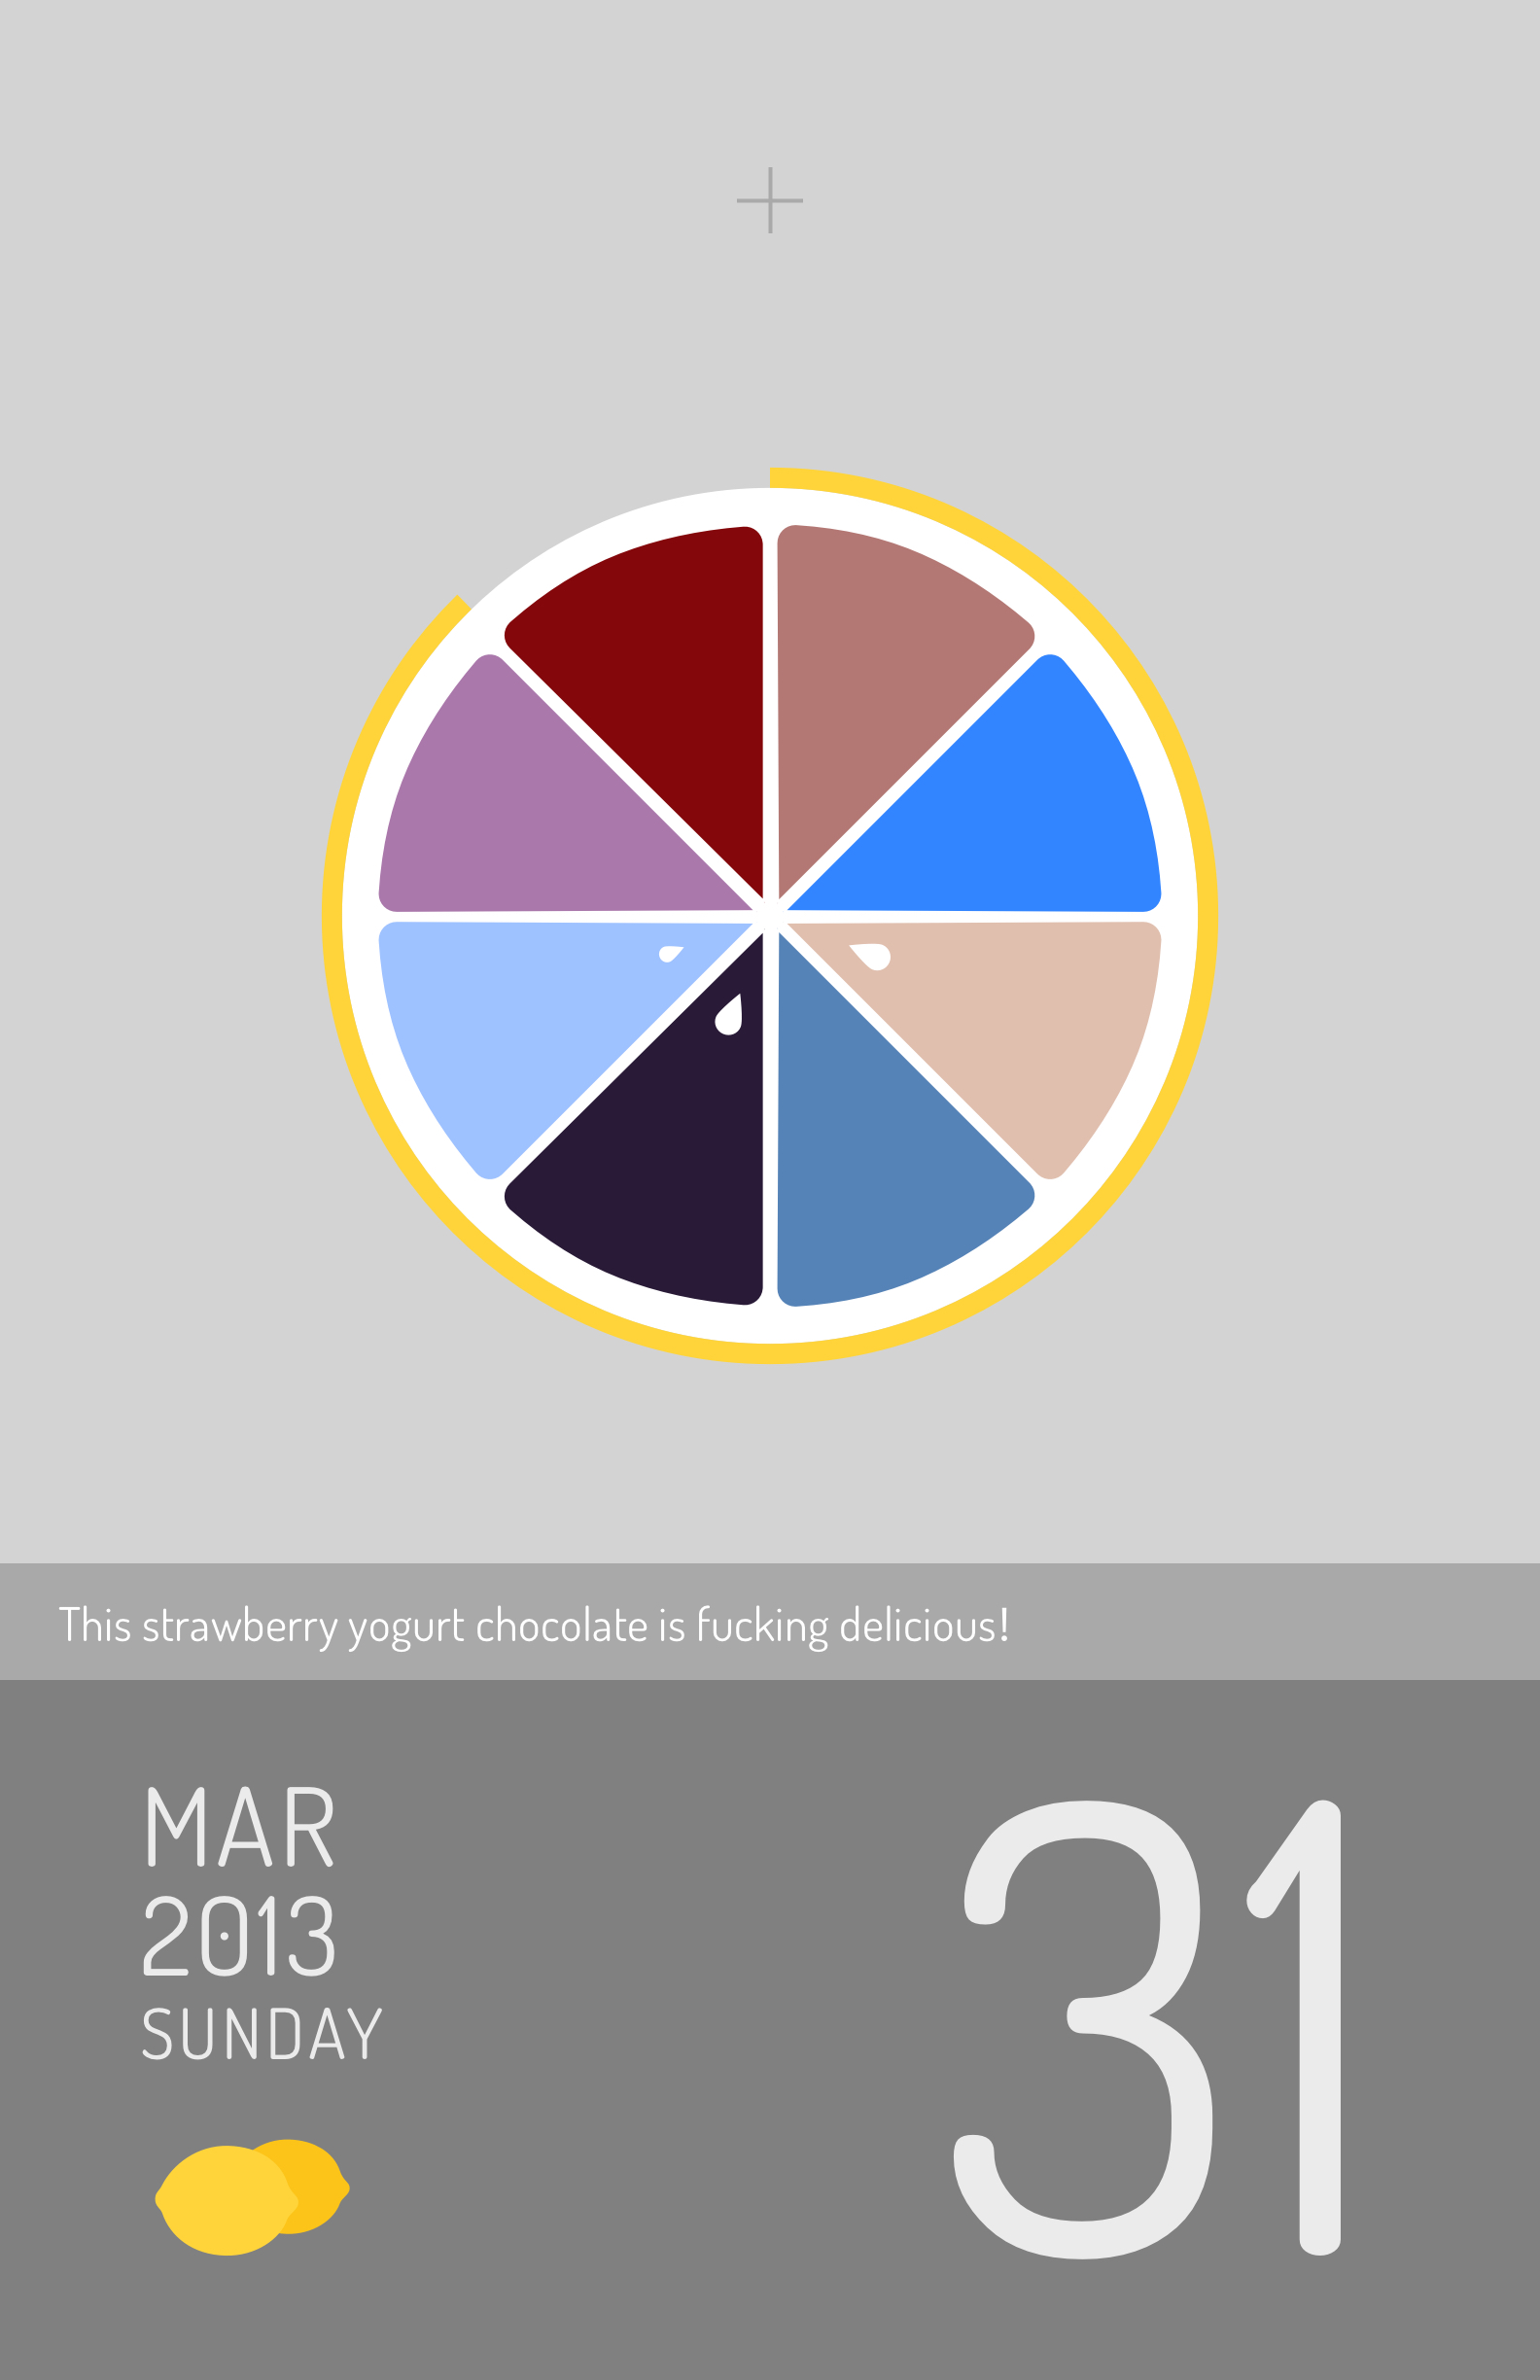
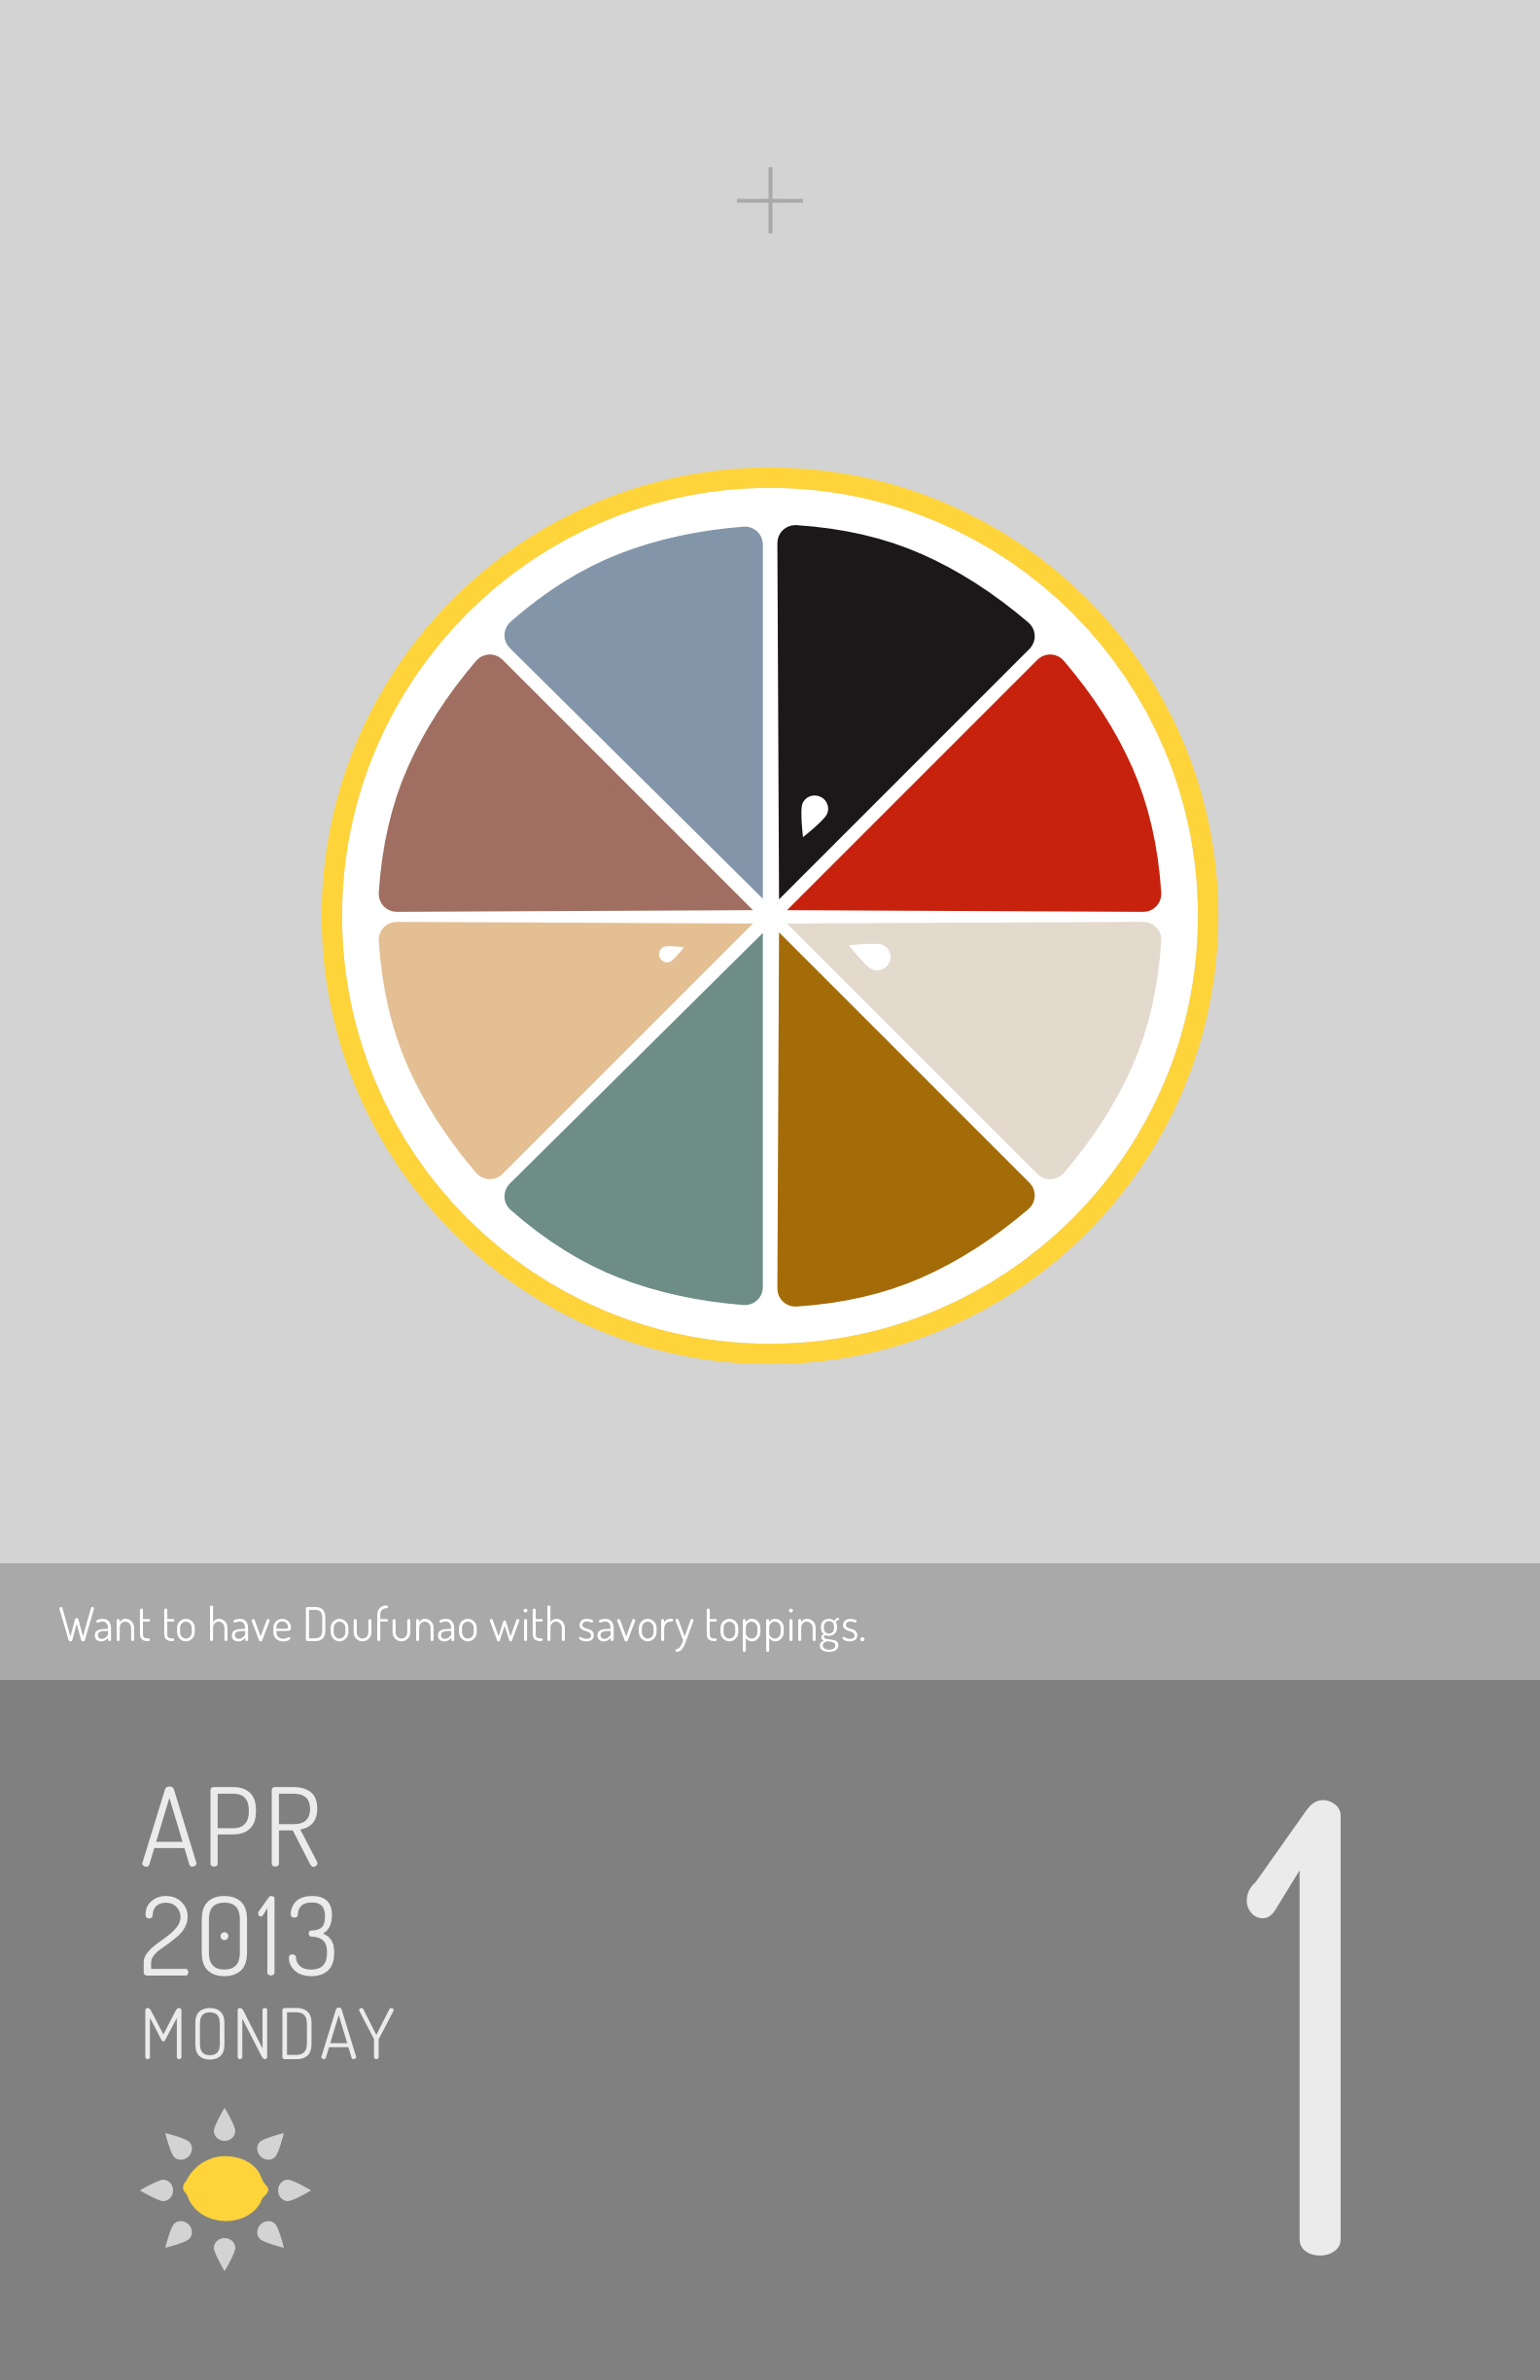
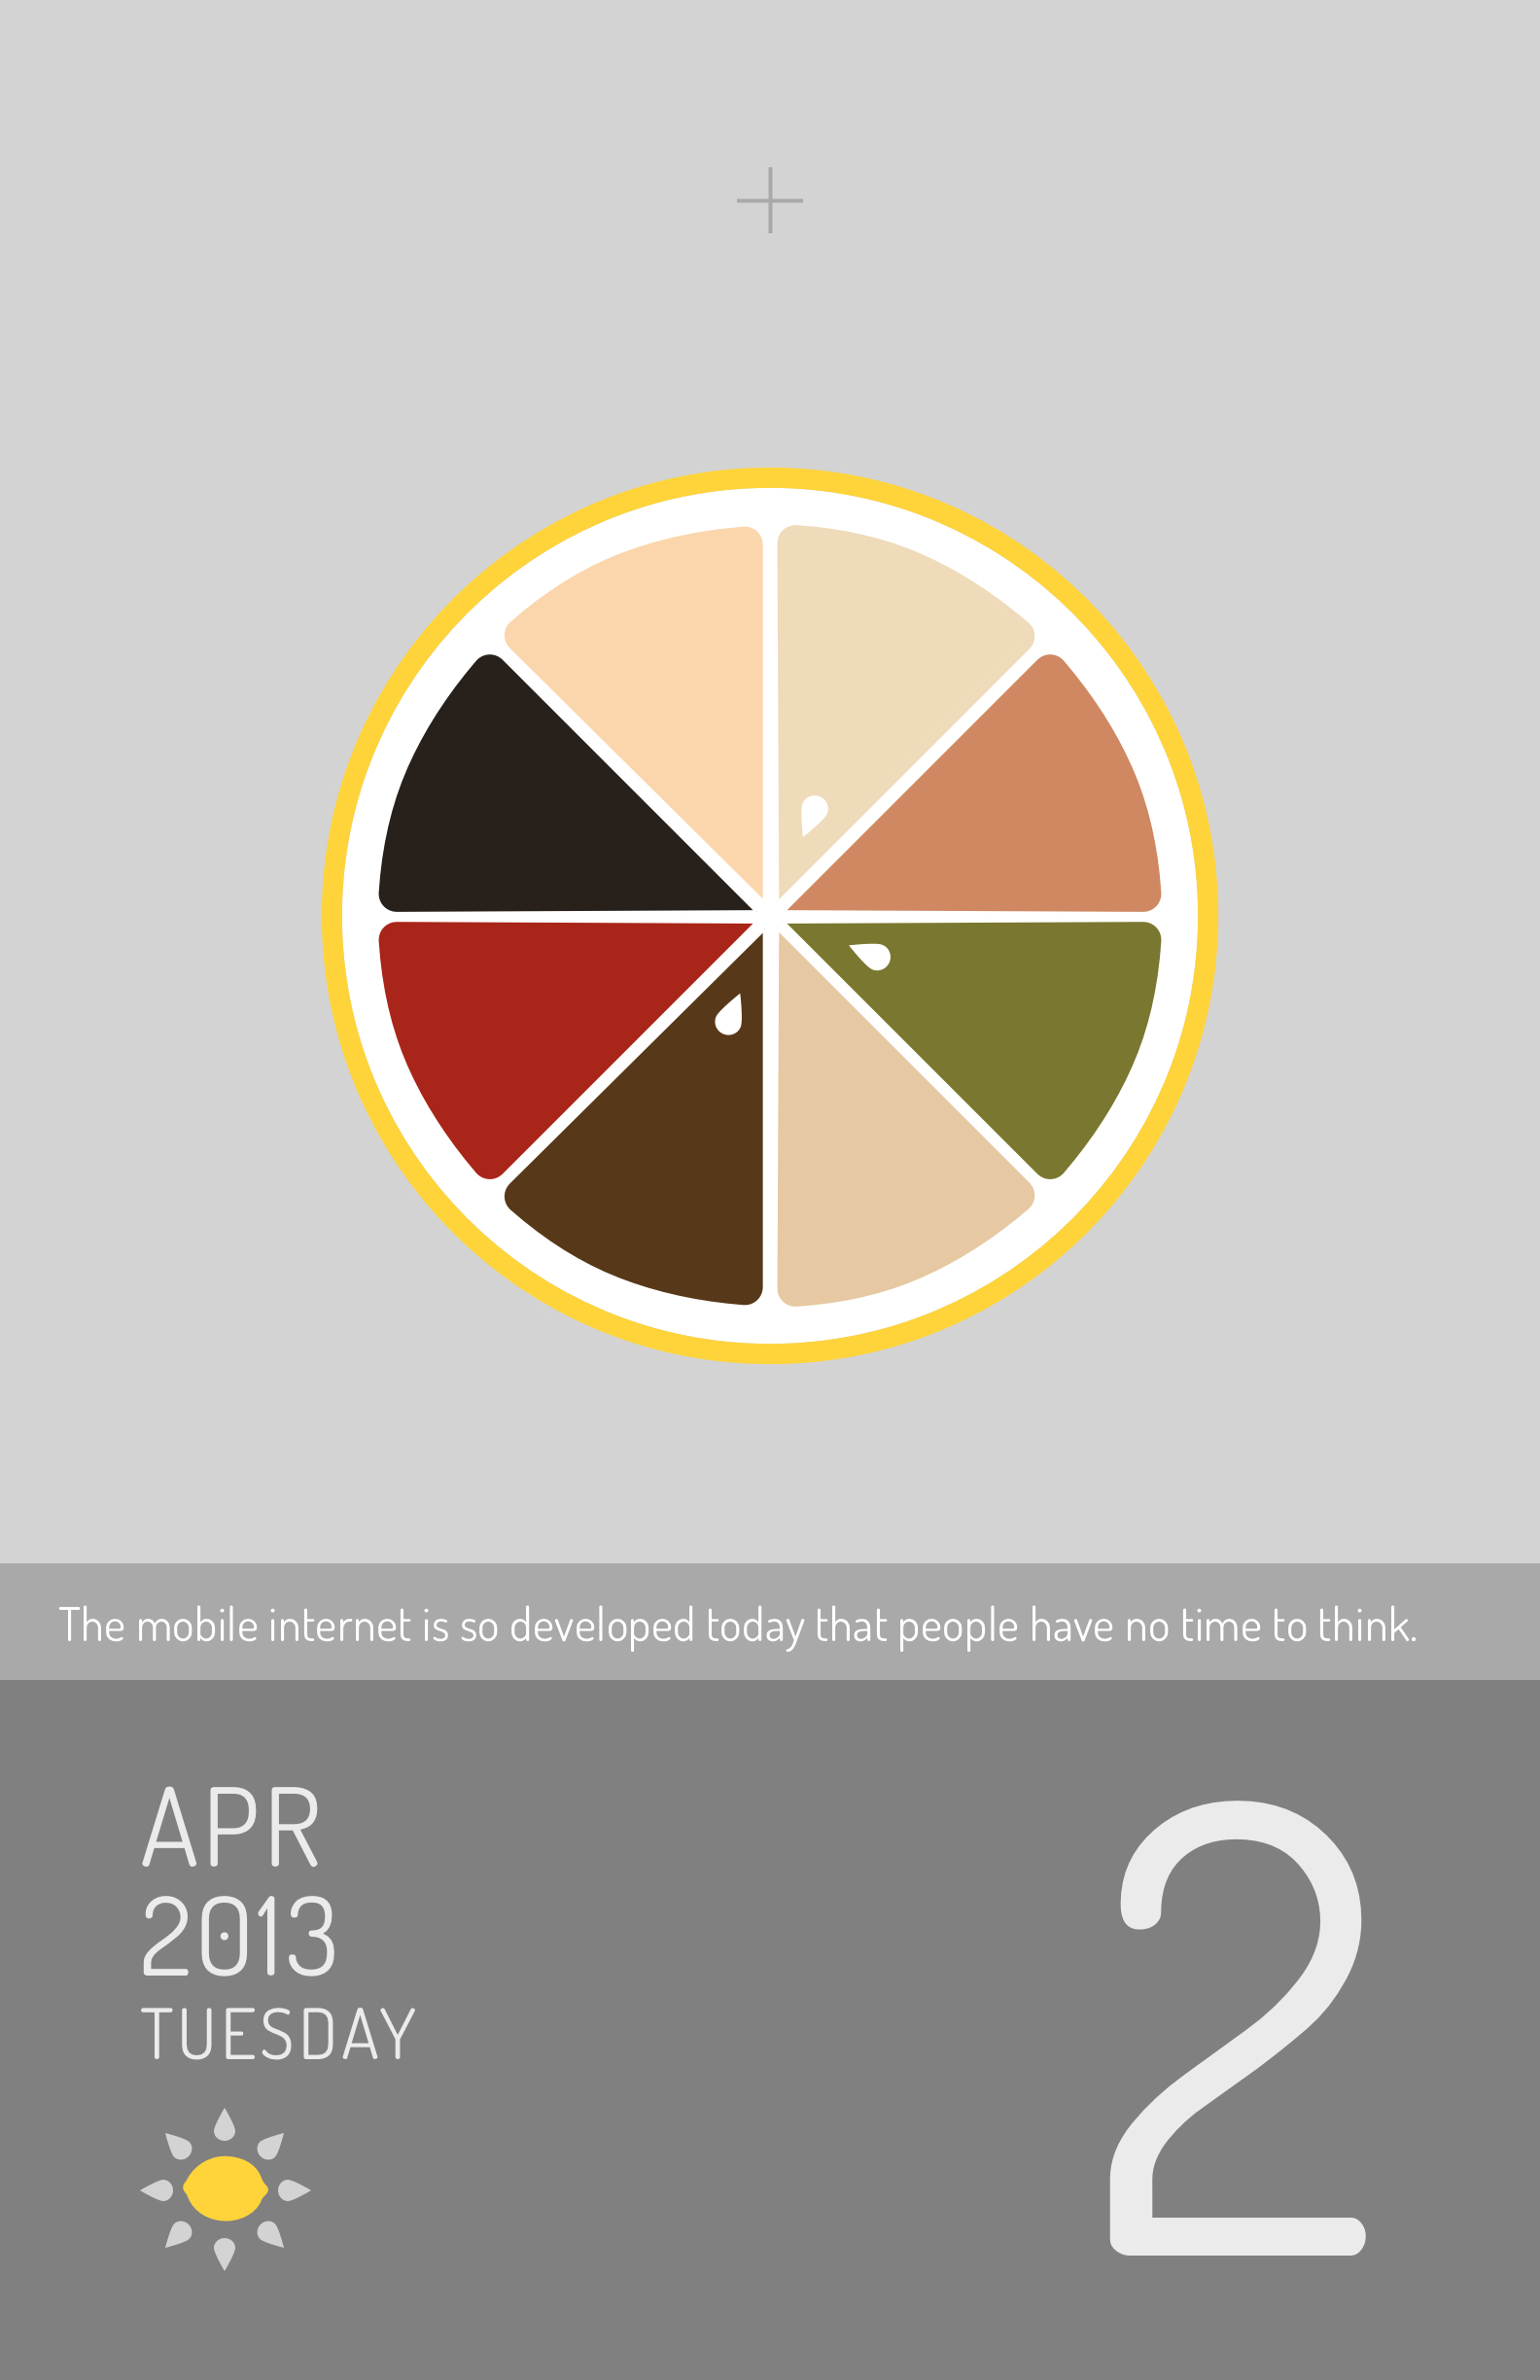
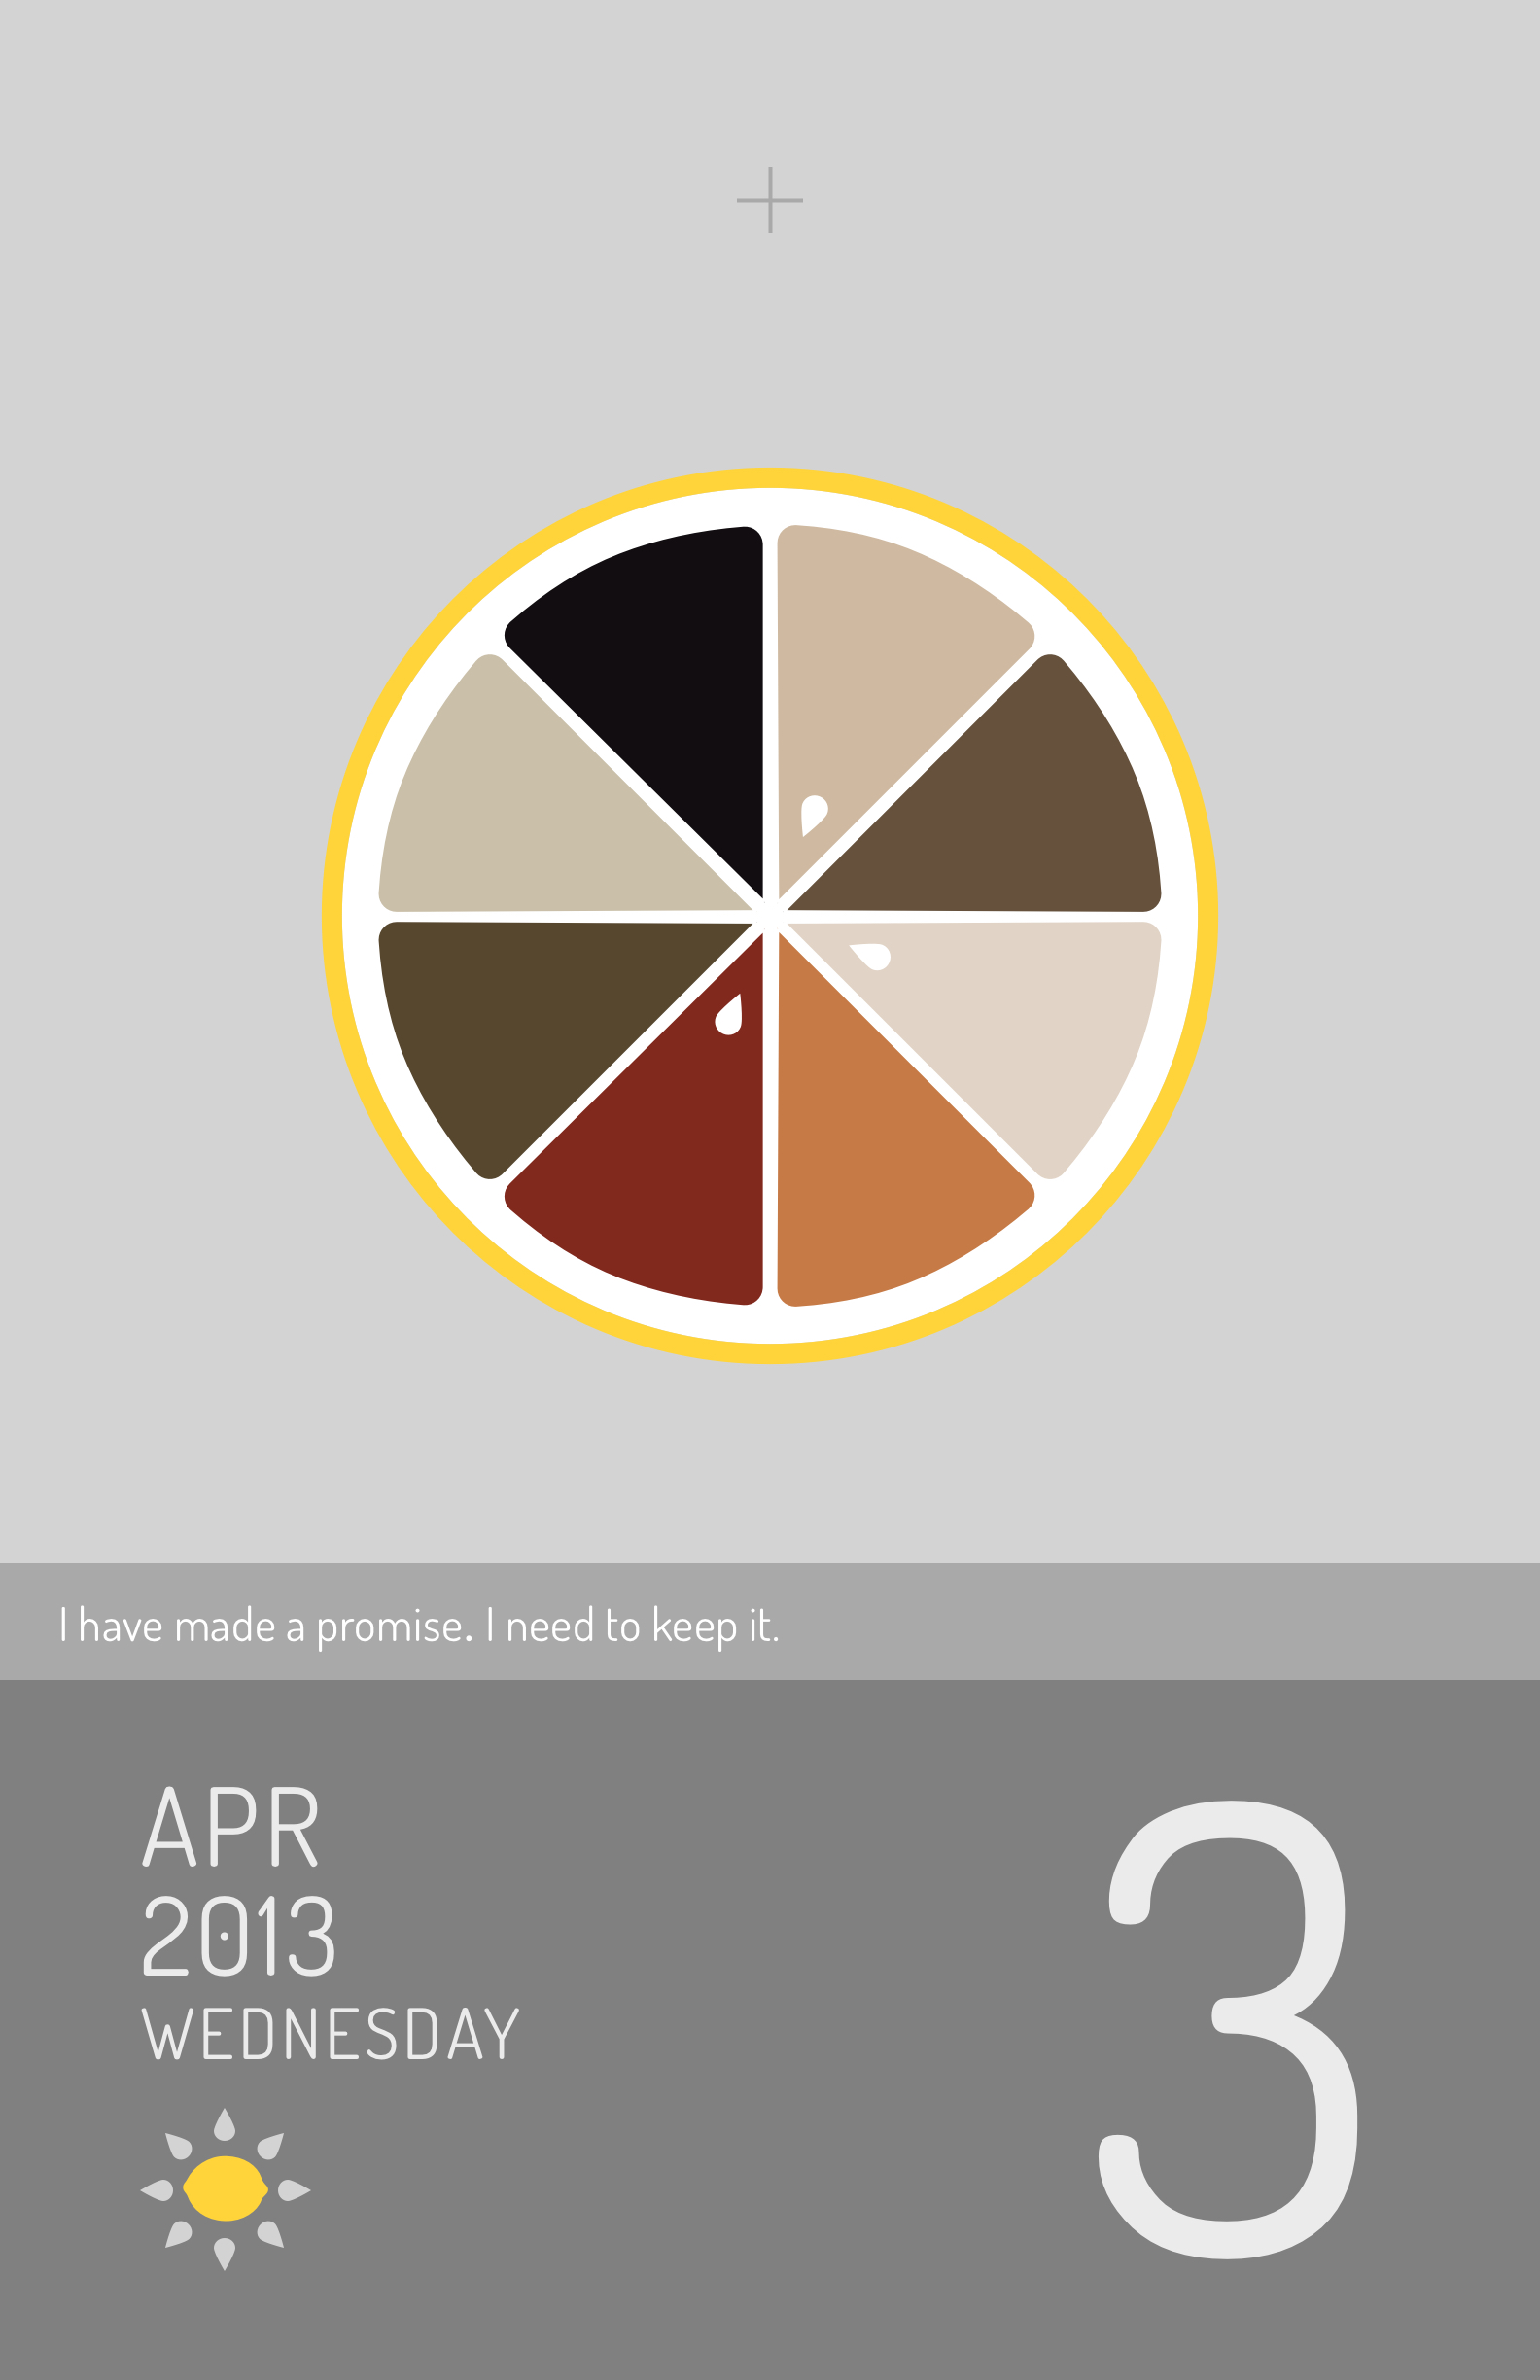
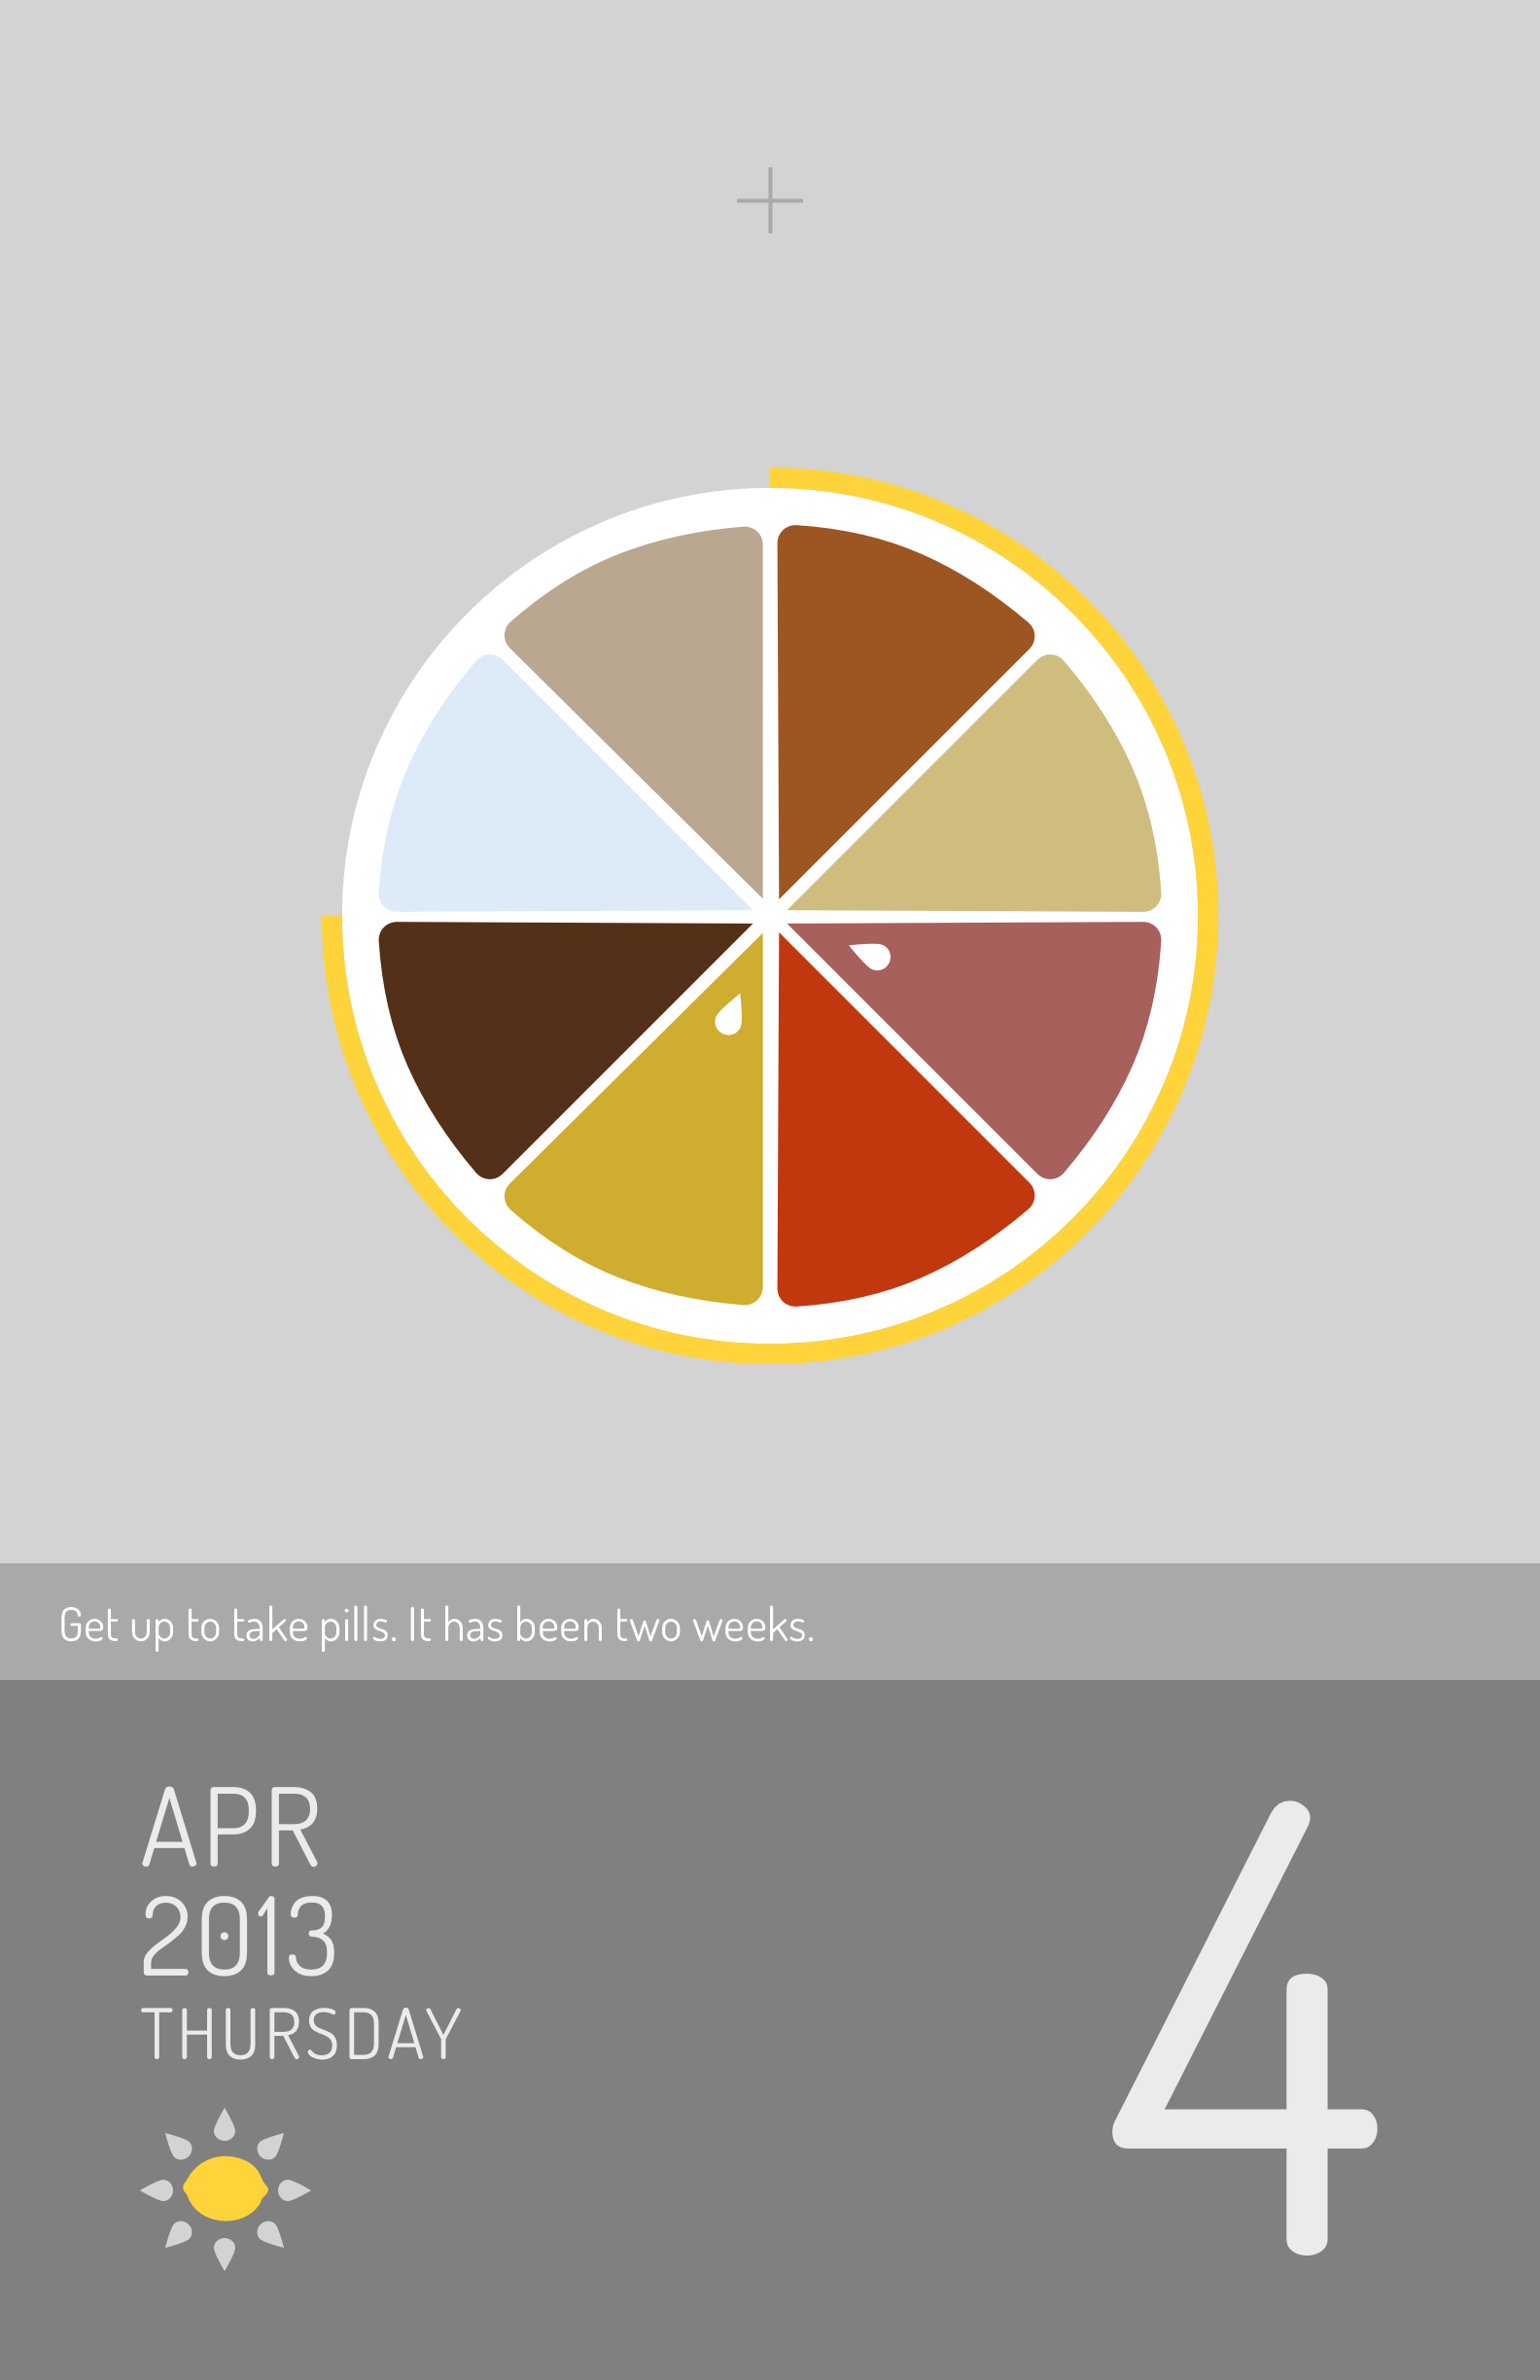
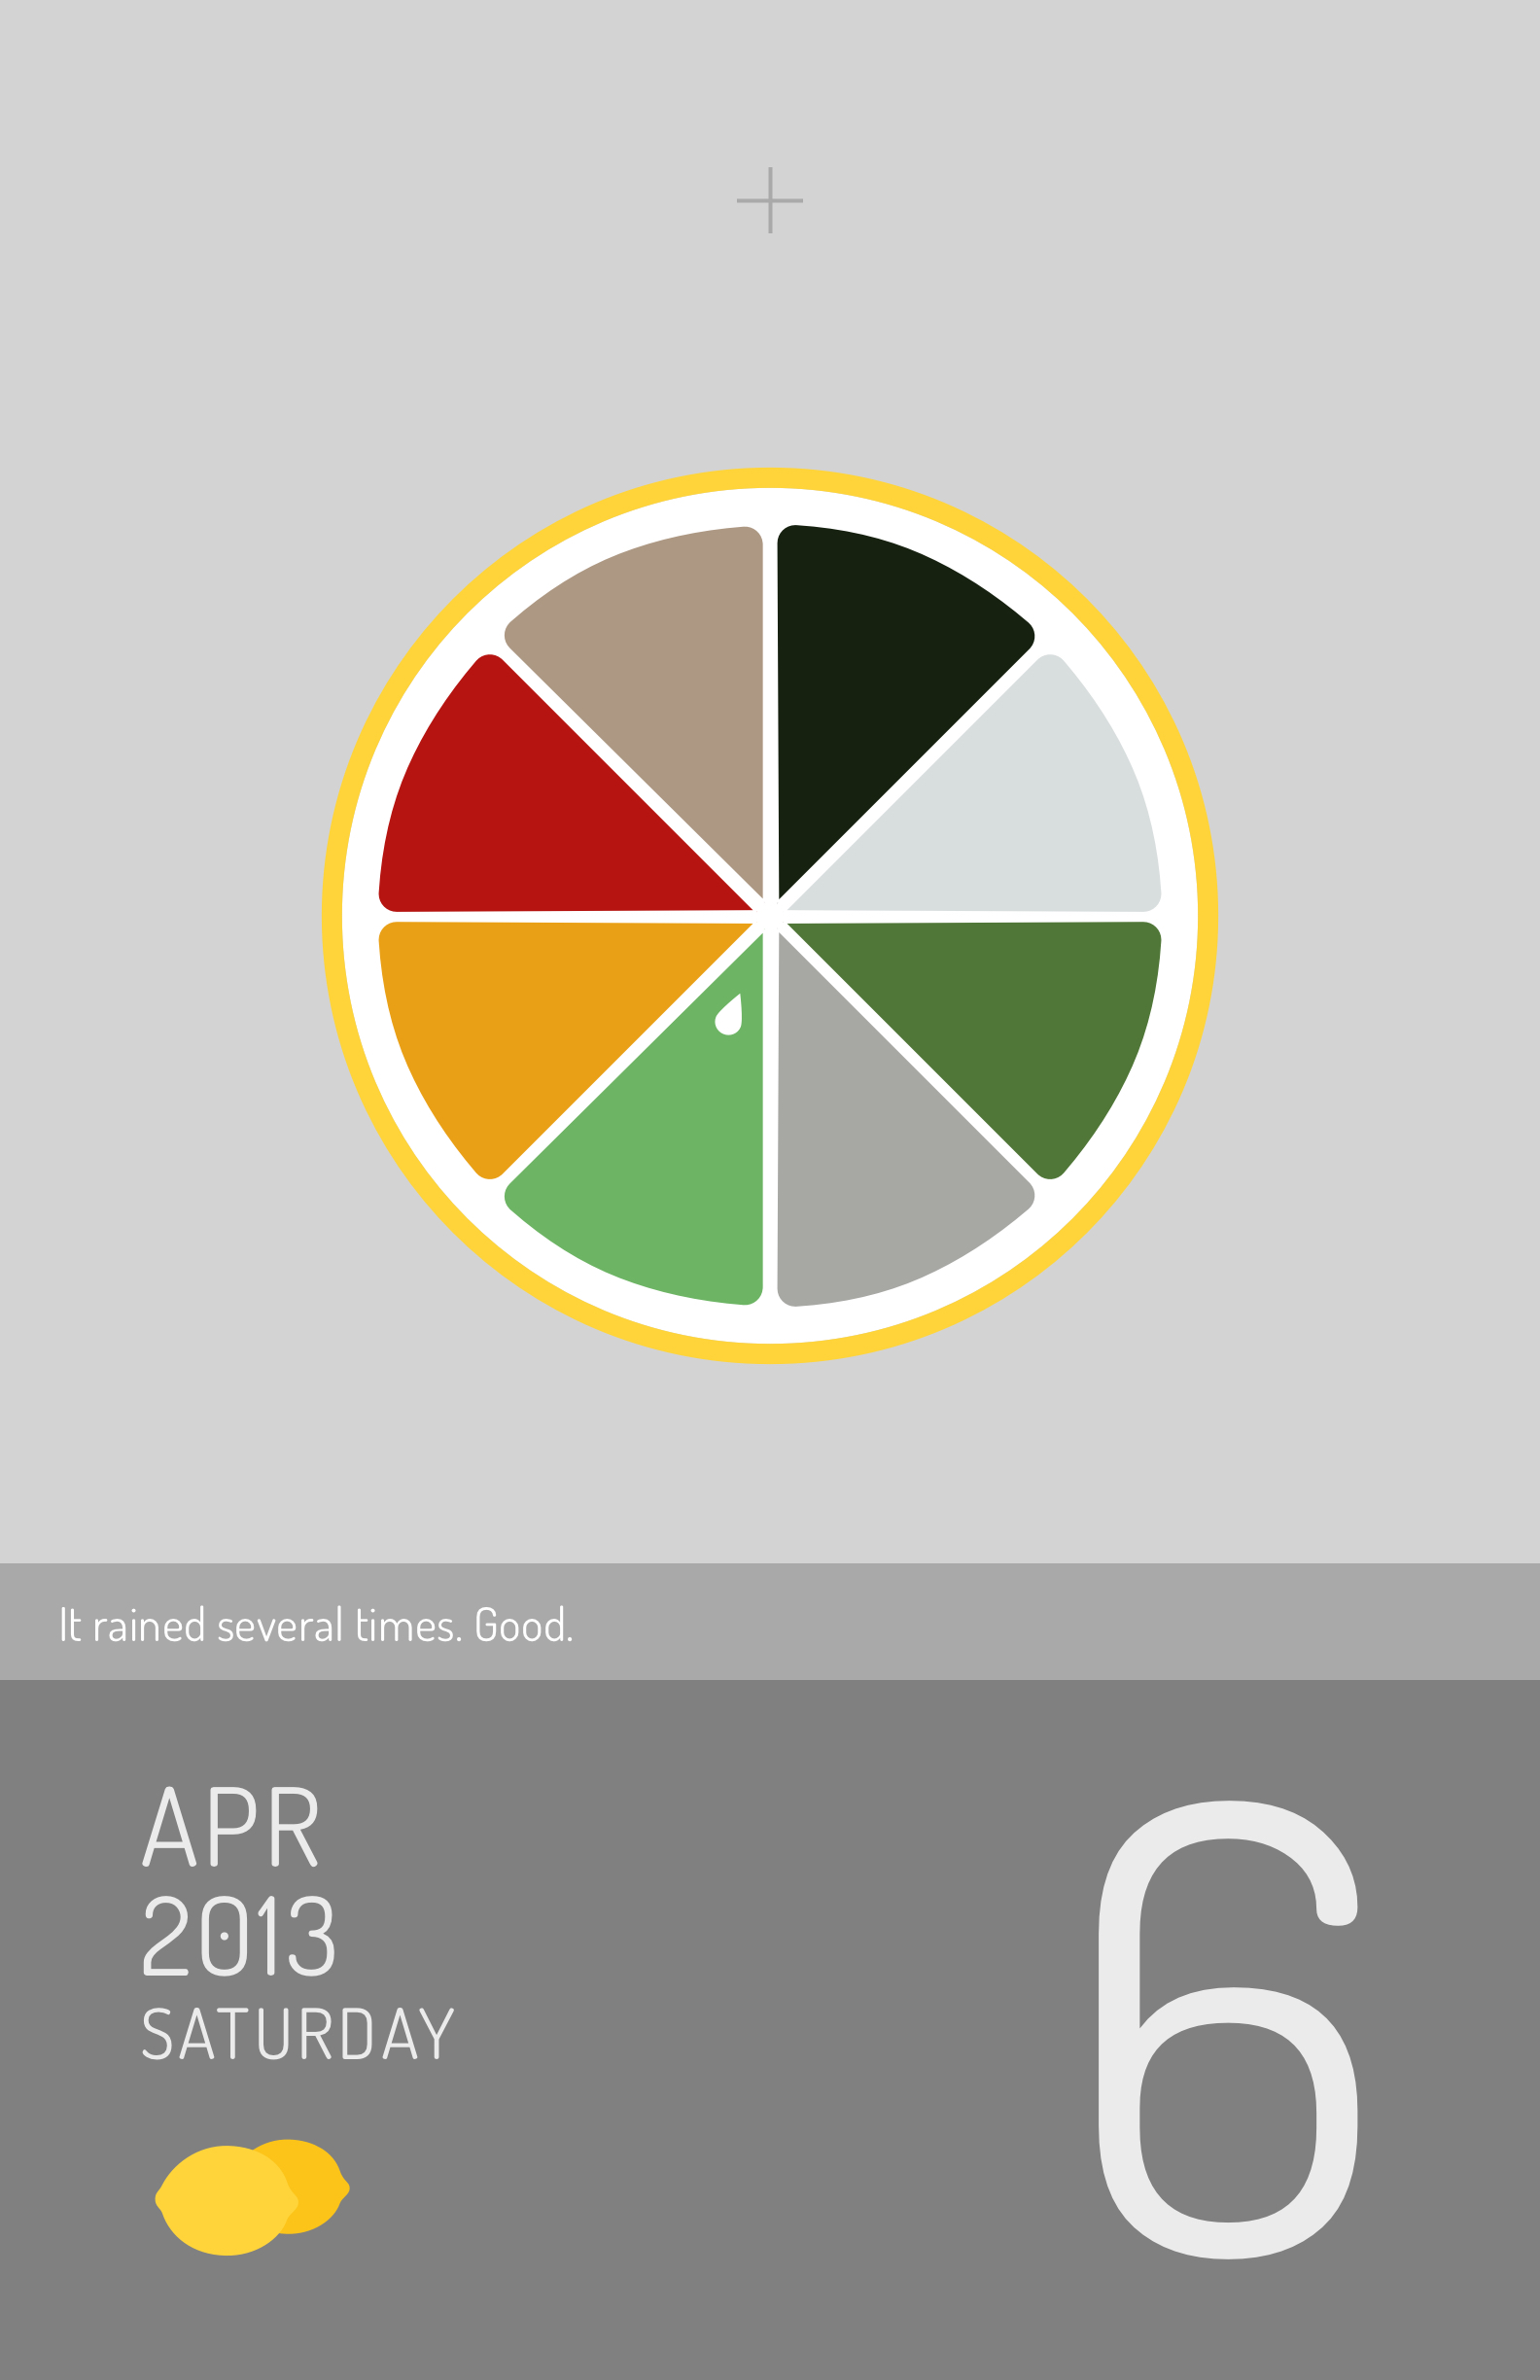
In this work, I visualized my sleep time, daily meals, color palettes from everyday photos, and the weather.
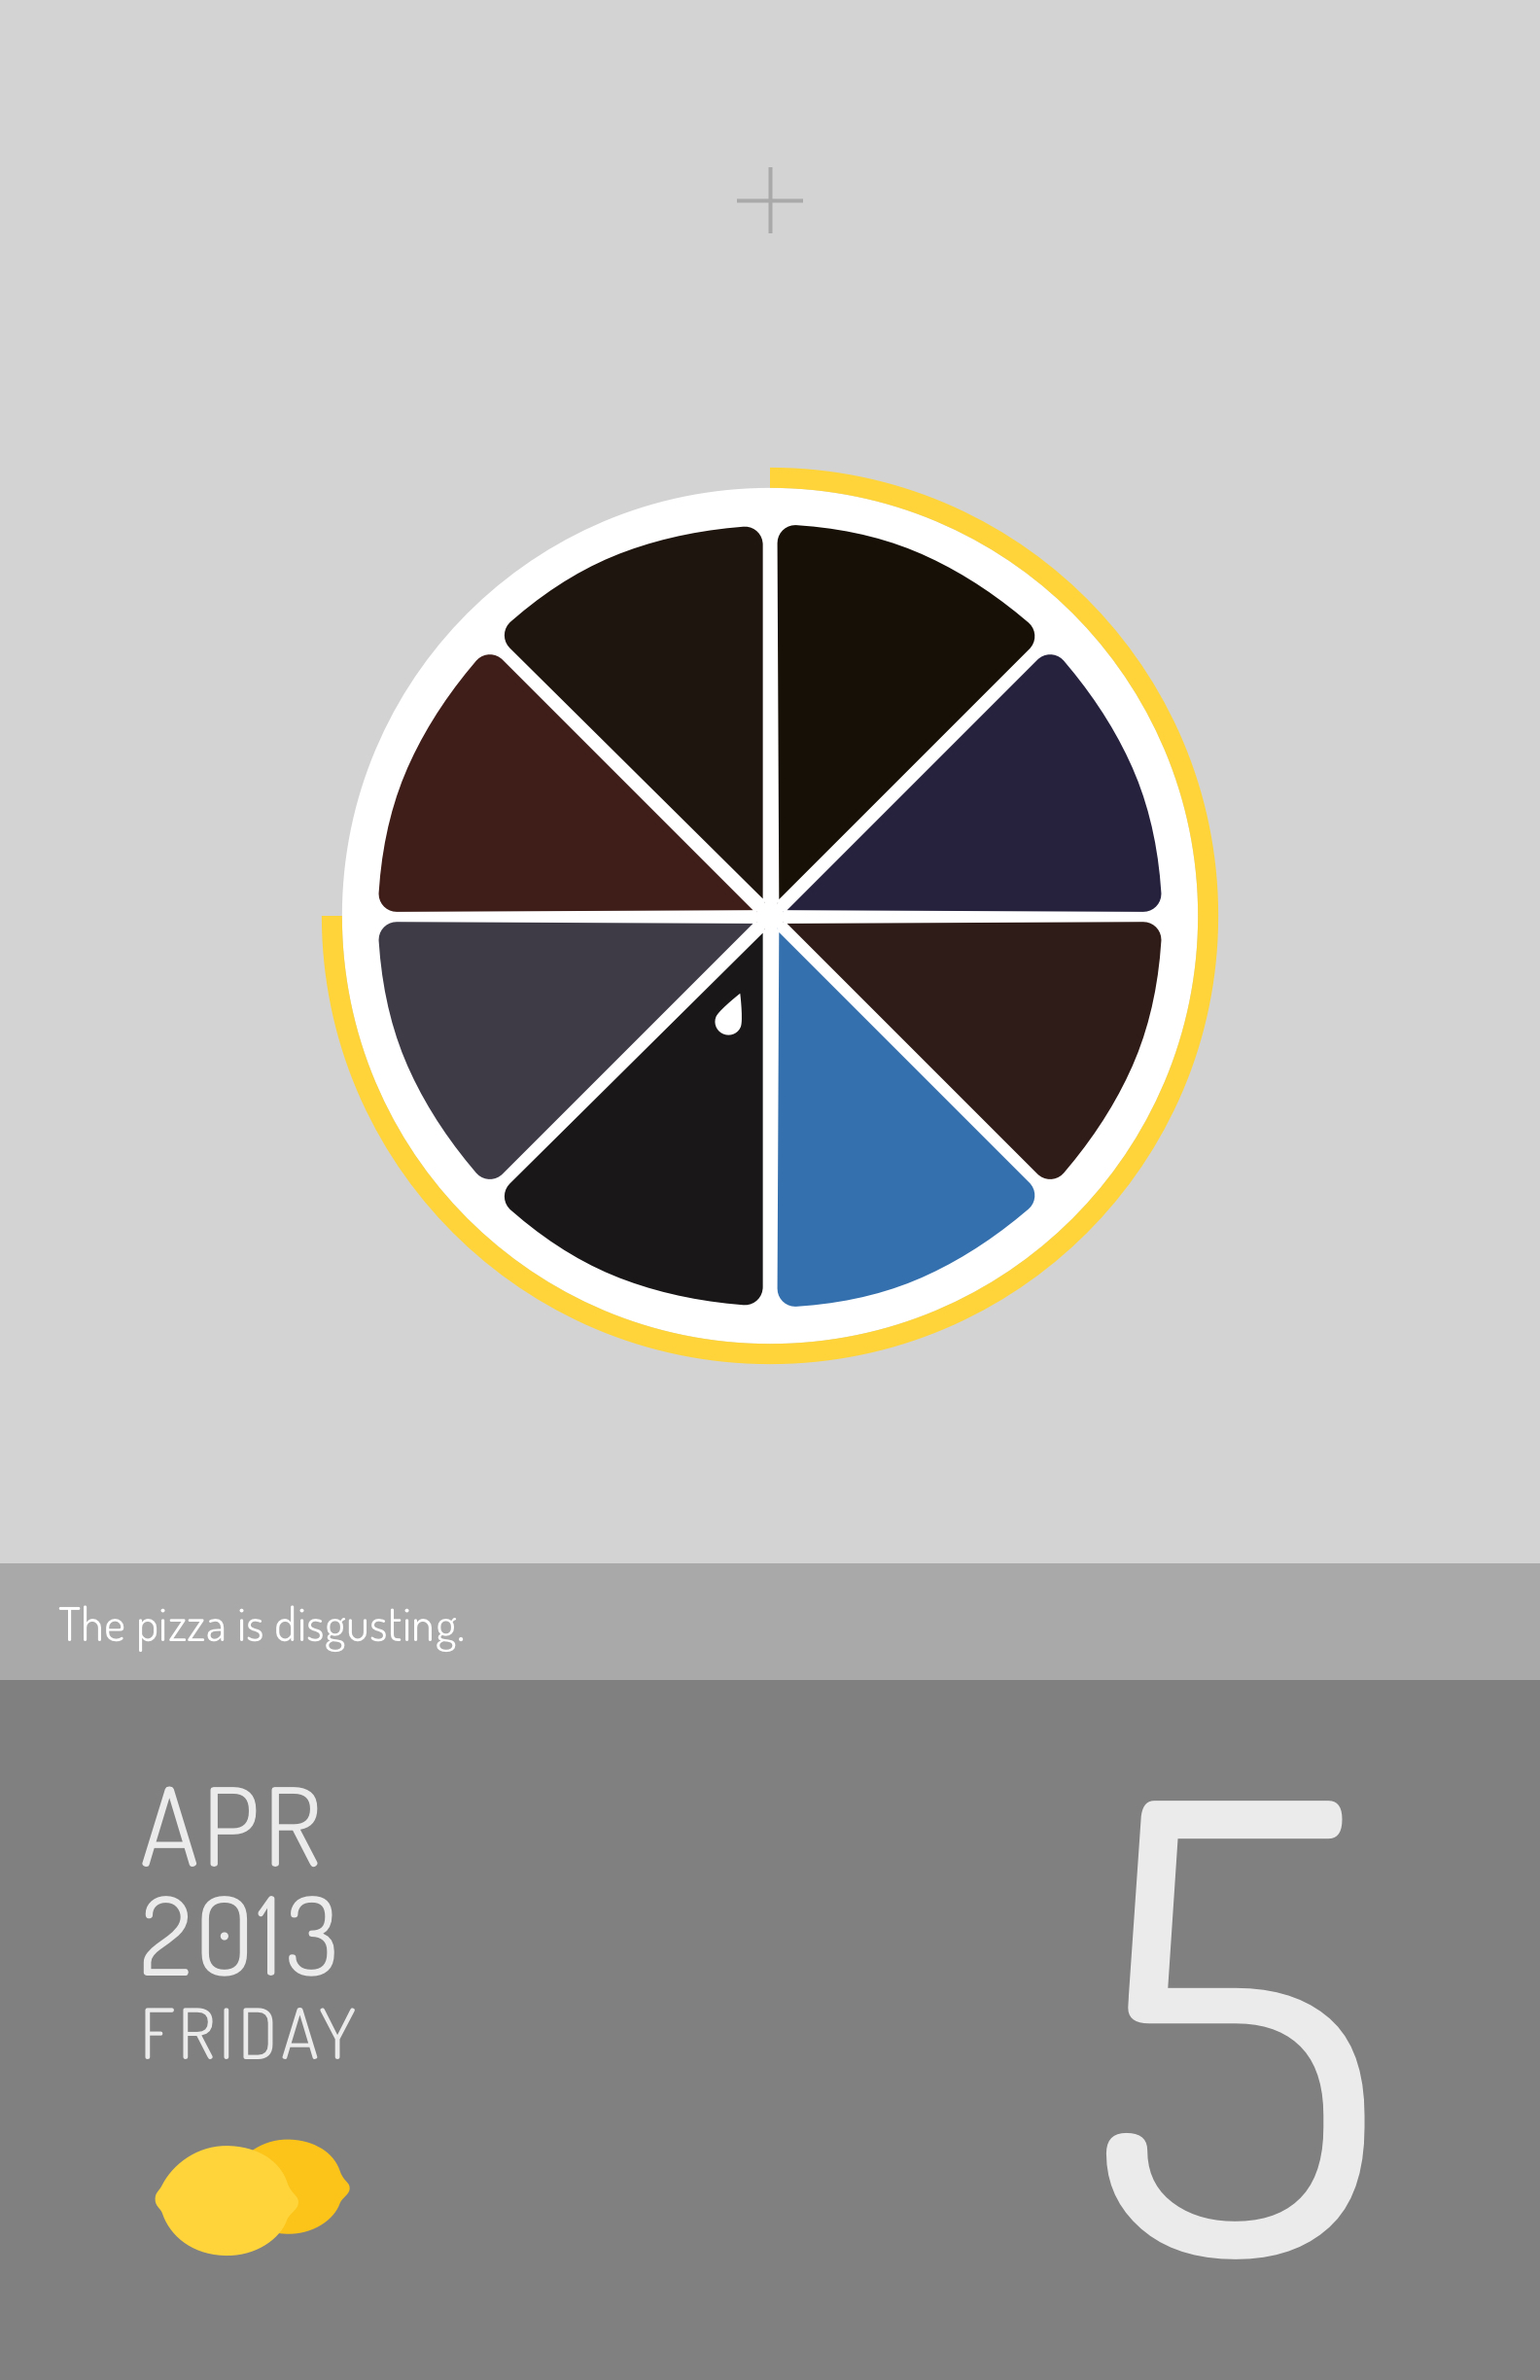
I used different shades of grey for the colors to express my feelings of “lemon days” intentionally.
Because I want to tell people that depression is different from sadness;
I was not upset but had no feelings or mood swings on everything.
I cannot feel dark or bright.
My world was only grey.
IDEATION
GATHER DATA
I tried to recreate the depression experience by reviewing memories in that period. Here are the data types I have in records.


DEFINE THE OPPORTUNITIES
Since the data were all tracked daily, I divided them by day. Each day is a group.
a group of daily data
👇
calendar
DESIGN & MAKE