Storytelling
TREASURE BOX
Game Design & Experience Design
Estimate reading time: ⏳⏳⏳⏳⏳

TIME VISUALIZATION
Data Visualization
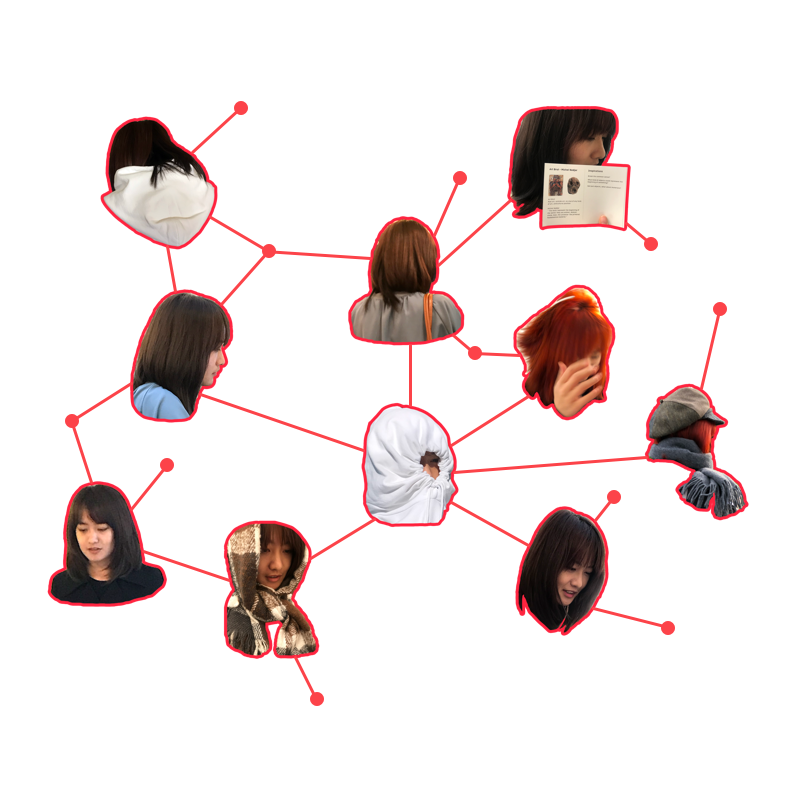
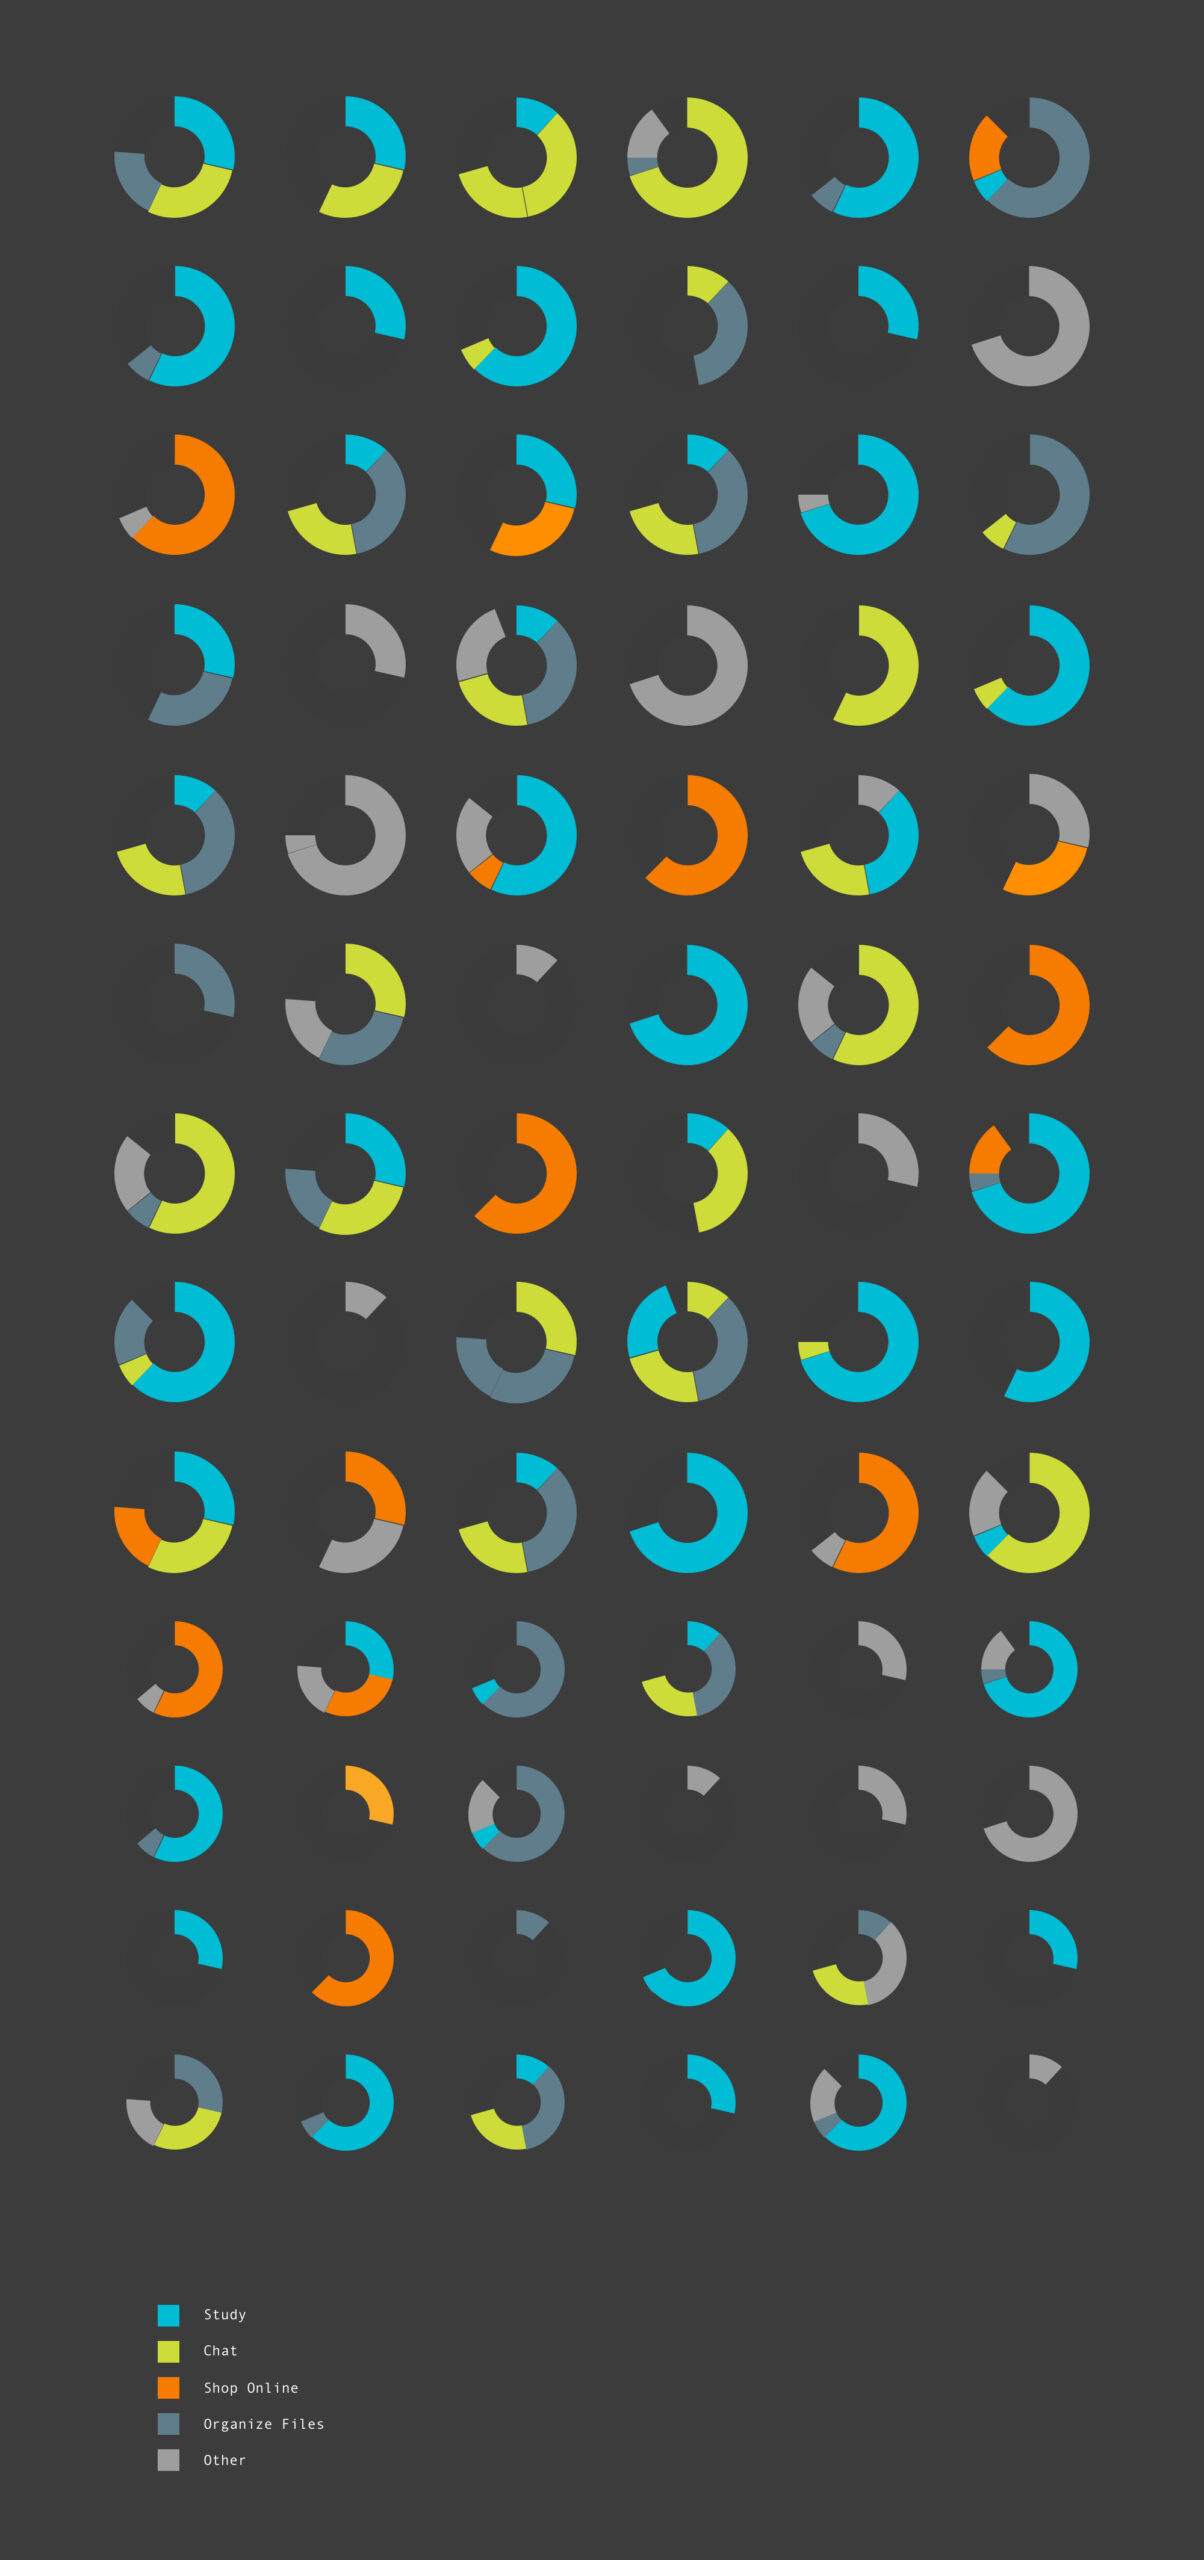
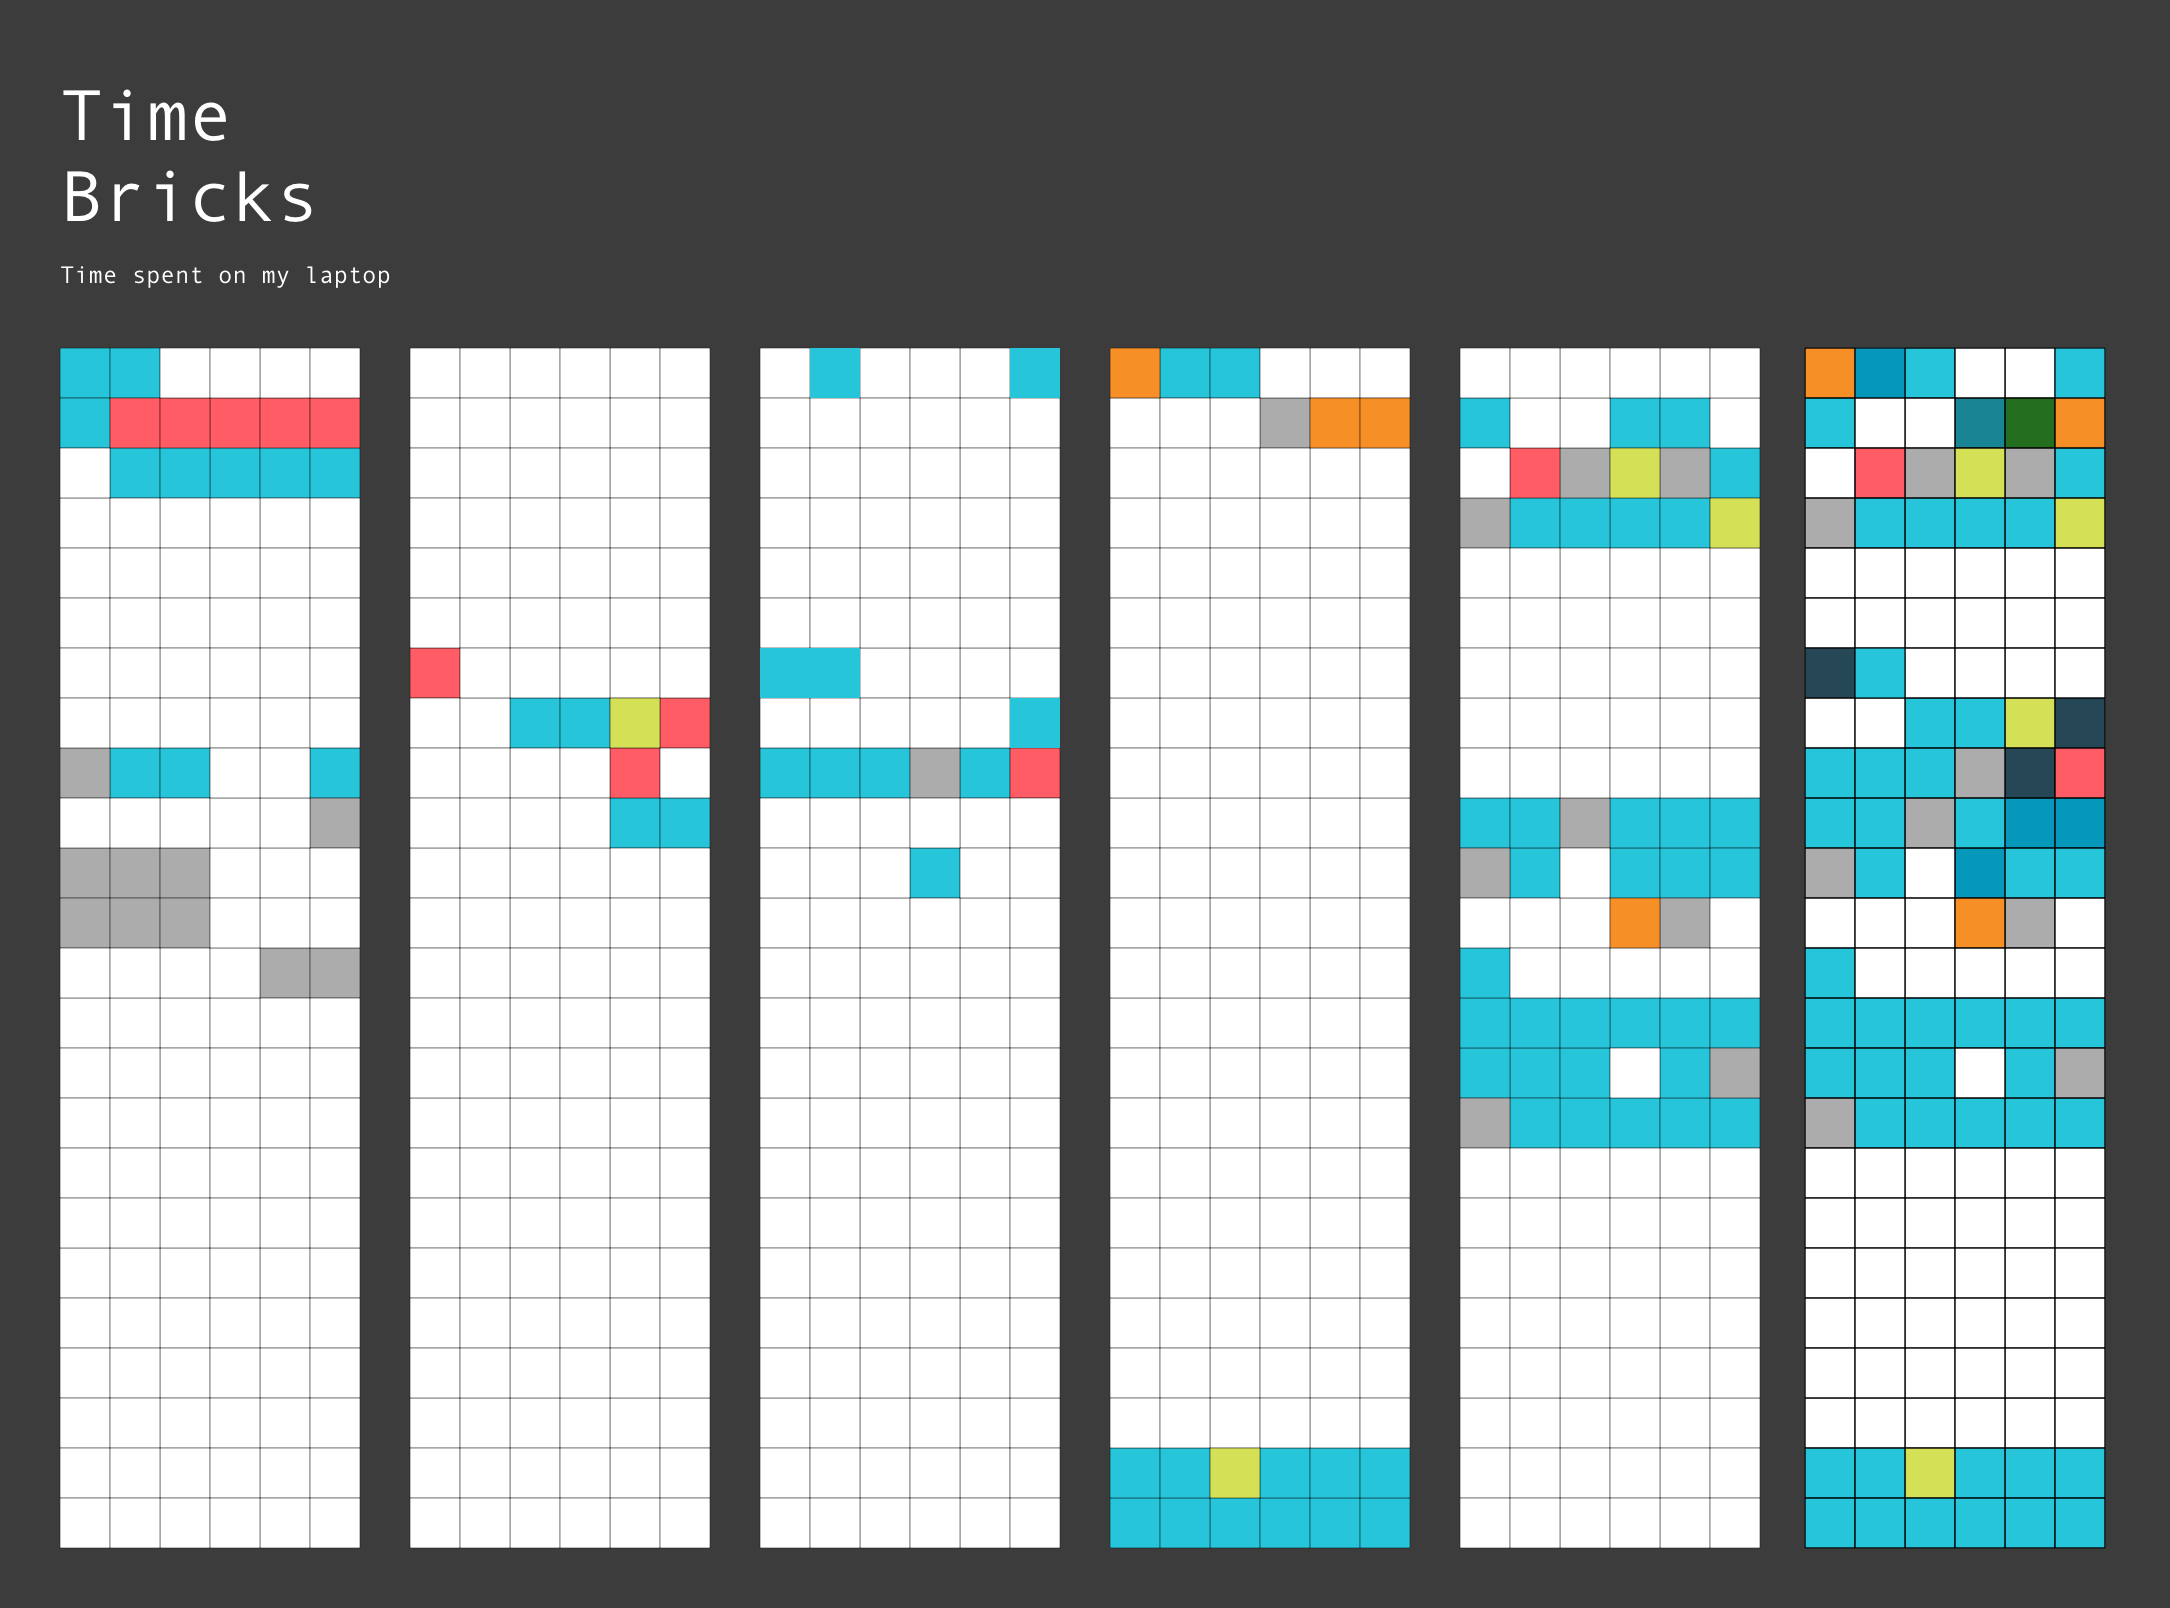
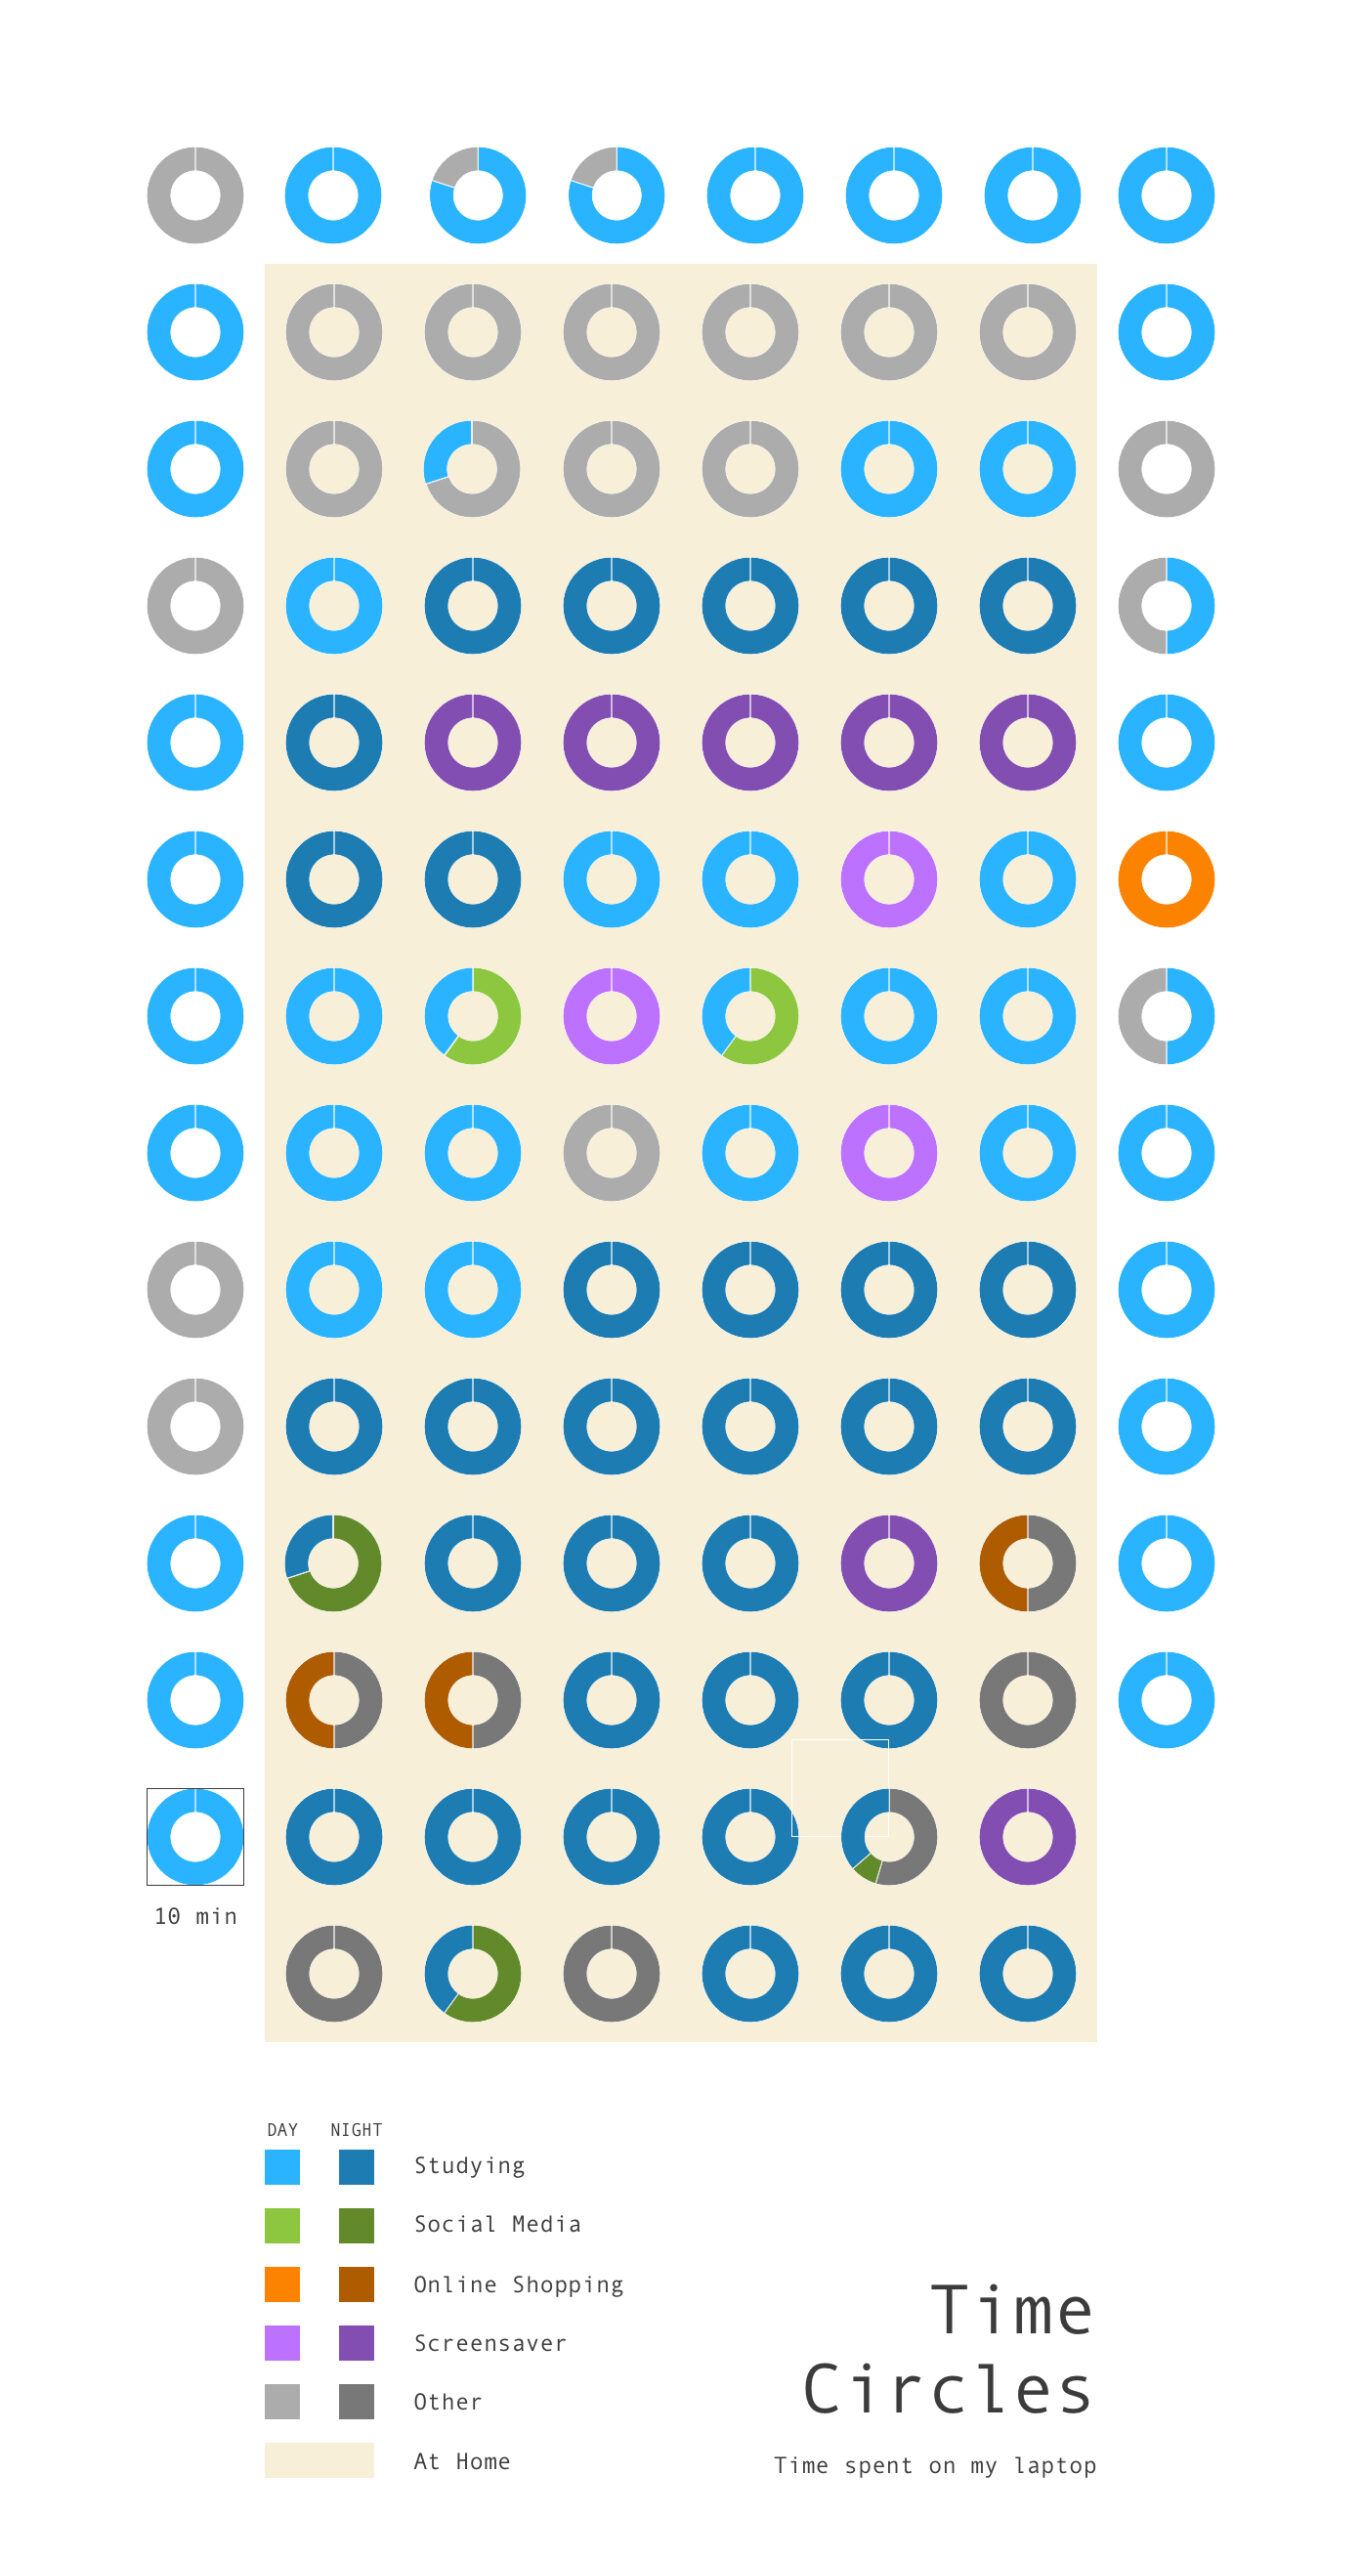
I collected four types of data about myself in a week; the places I have visited, the people I have talked to, the photos I have taken, and the time spent on my laptop. The four types of data were tracked continuously, from Saturday to Thursday, 144 hours in total. I paid particular attention to monitoring them and tried to keep them as accurate as possible. Finally, I focused on the time spent on my laptop and generated several concepts for it.
MAPPING MY DAY
Data Visualization
Three mes are id, ego, and super-ego. The concept was from Freud's structural model of the psyche. Id only follows the pleasure principle. Super-ego plays the critical and moralizing role. Ego is a compromise between id and ego. This map shows my daily activities, including studying, social, entertainment, shopping, and dining.

JOYFUL MOMENTS DURING COVID-19
Data Visualization
Lauren lives in Denver and Zhu lives in Seattle. Like many others, are both staying at home more due to COVID-19. The media assume people are less happy than the days before the pandemic. With this experiment of tracking our joyful moments, we focus more on small details in our daily lives. We want to tell a story that the joyful moments are more than we expected if you pay attention to them.
Questioning
Just for fun!

PLAY WITH BUTTONS
Programming
It is how I taught myself JavaScript as a beginner. I have made fifty buttons with different interactions. Learning by doing is a better way for me than watching tutorials.
MY BEDROOM
Model Making
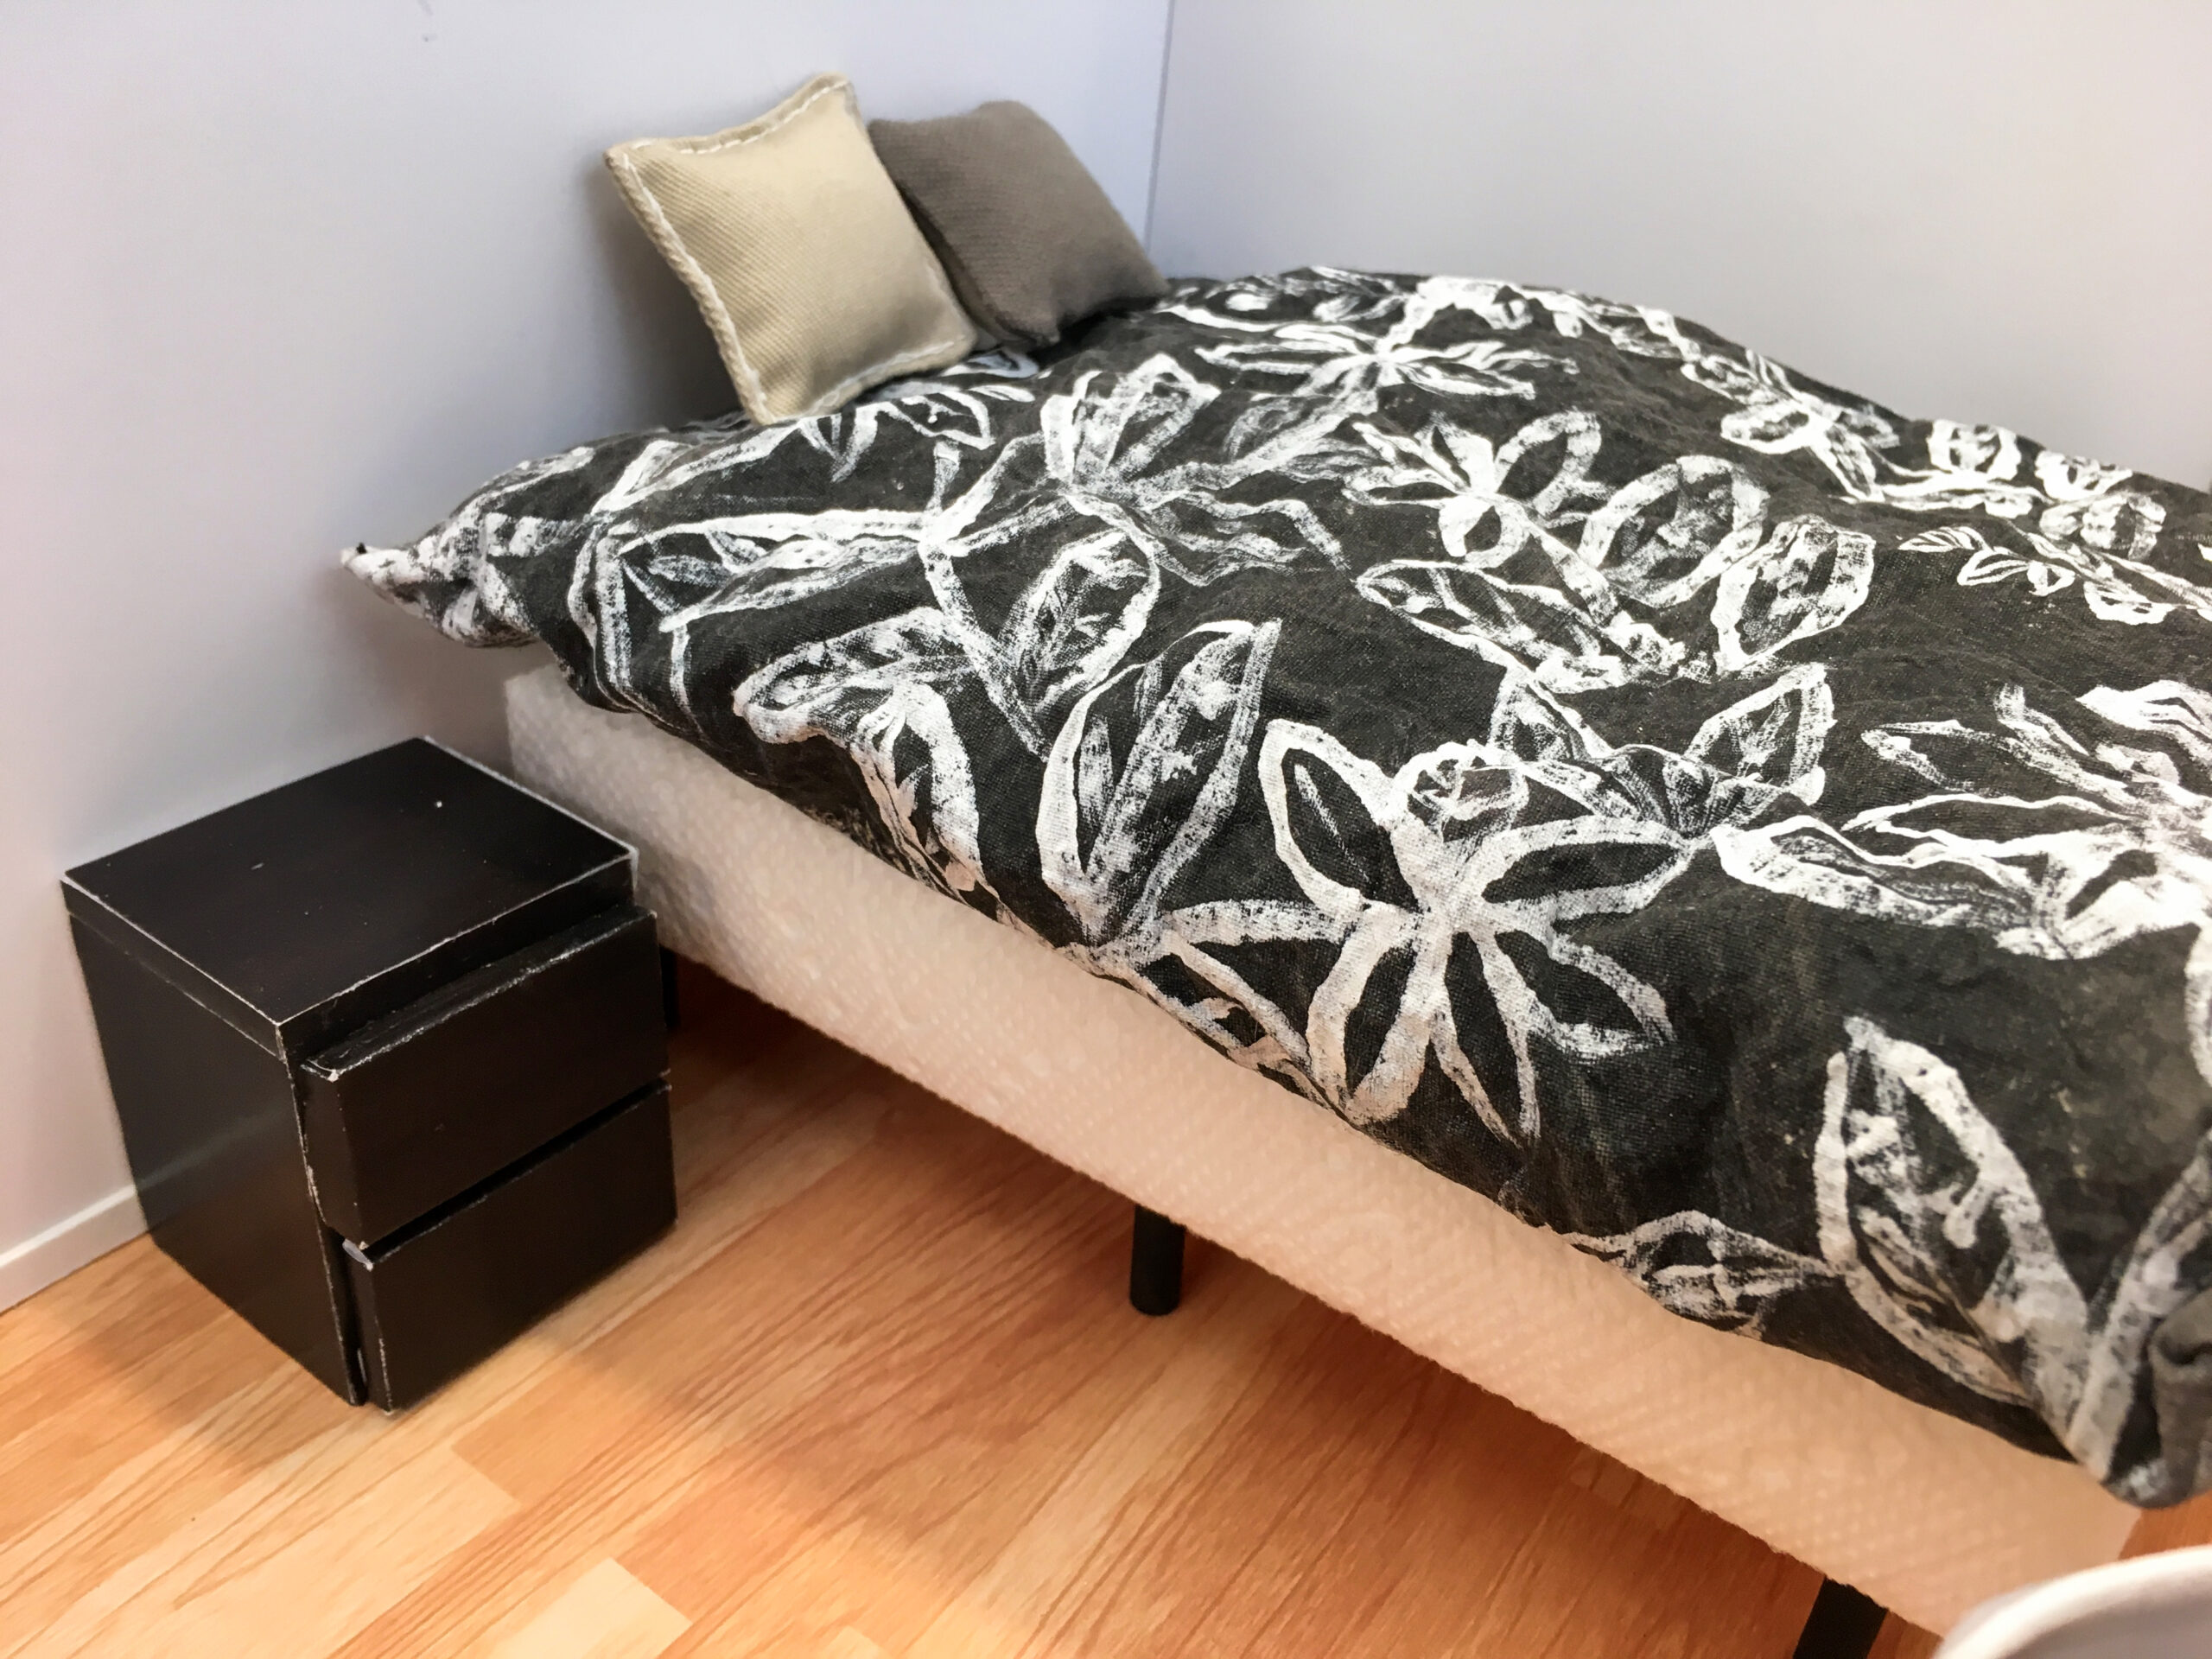
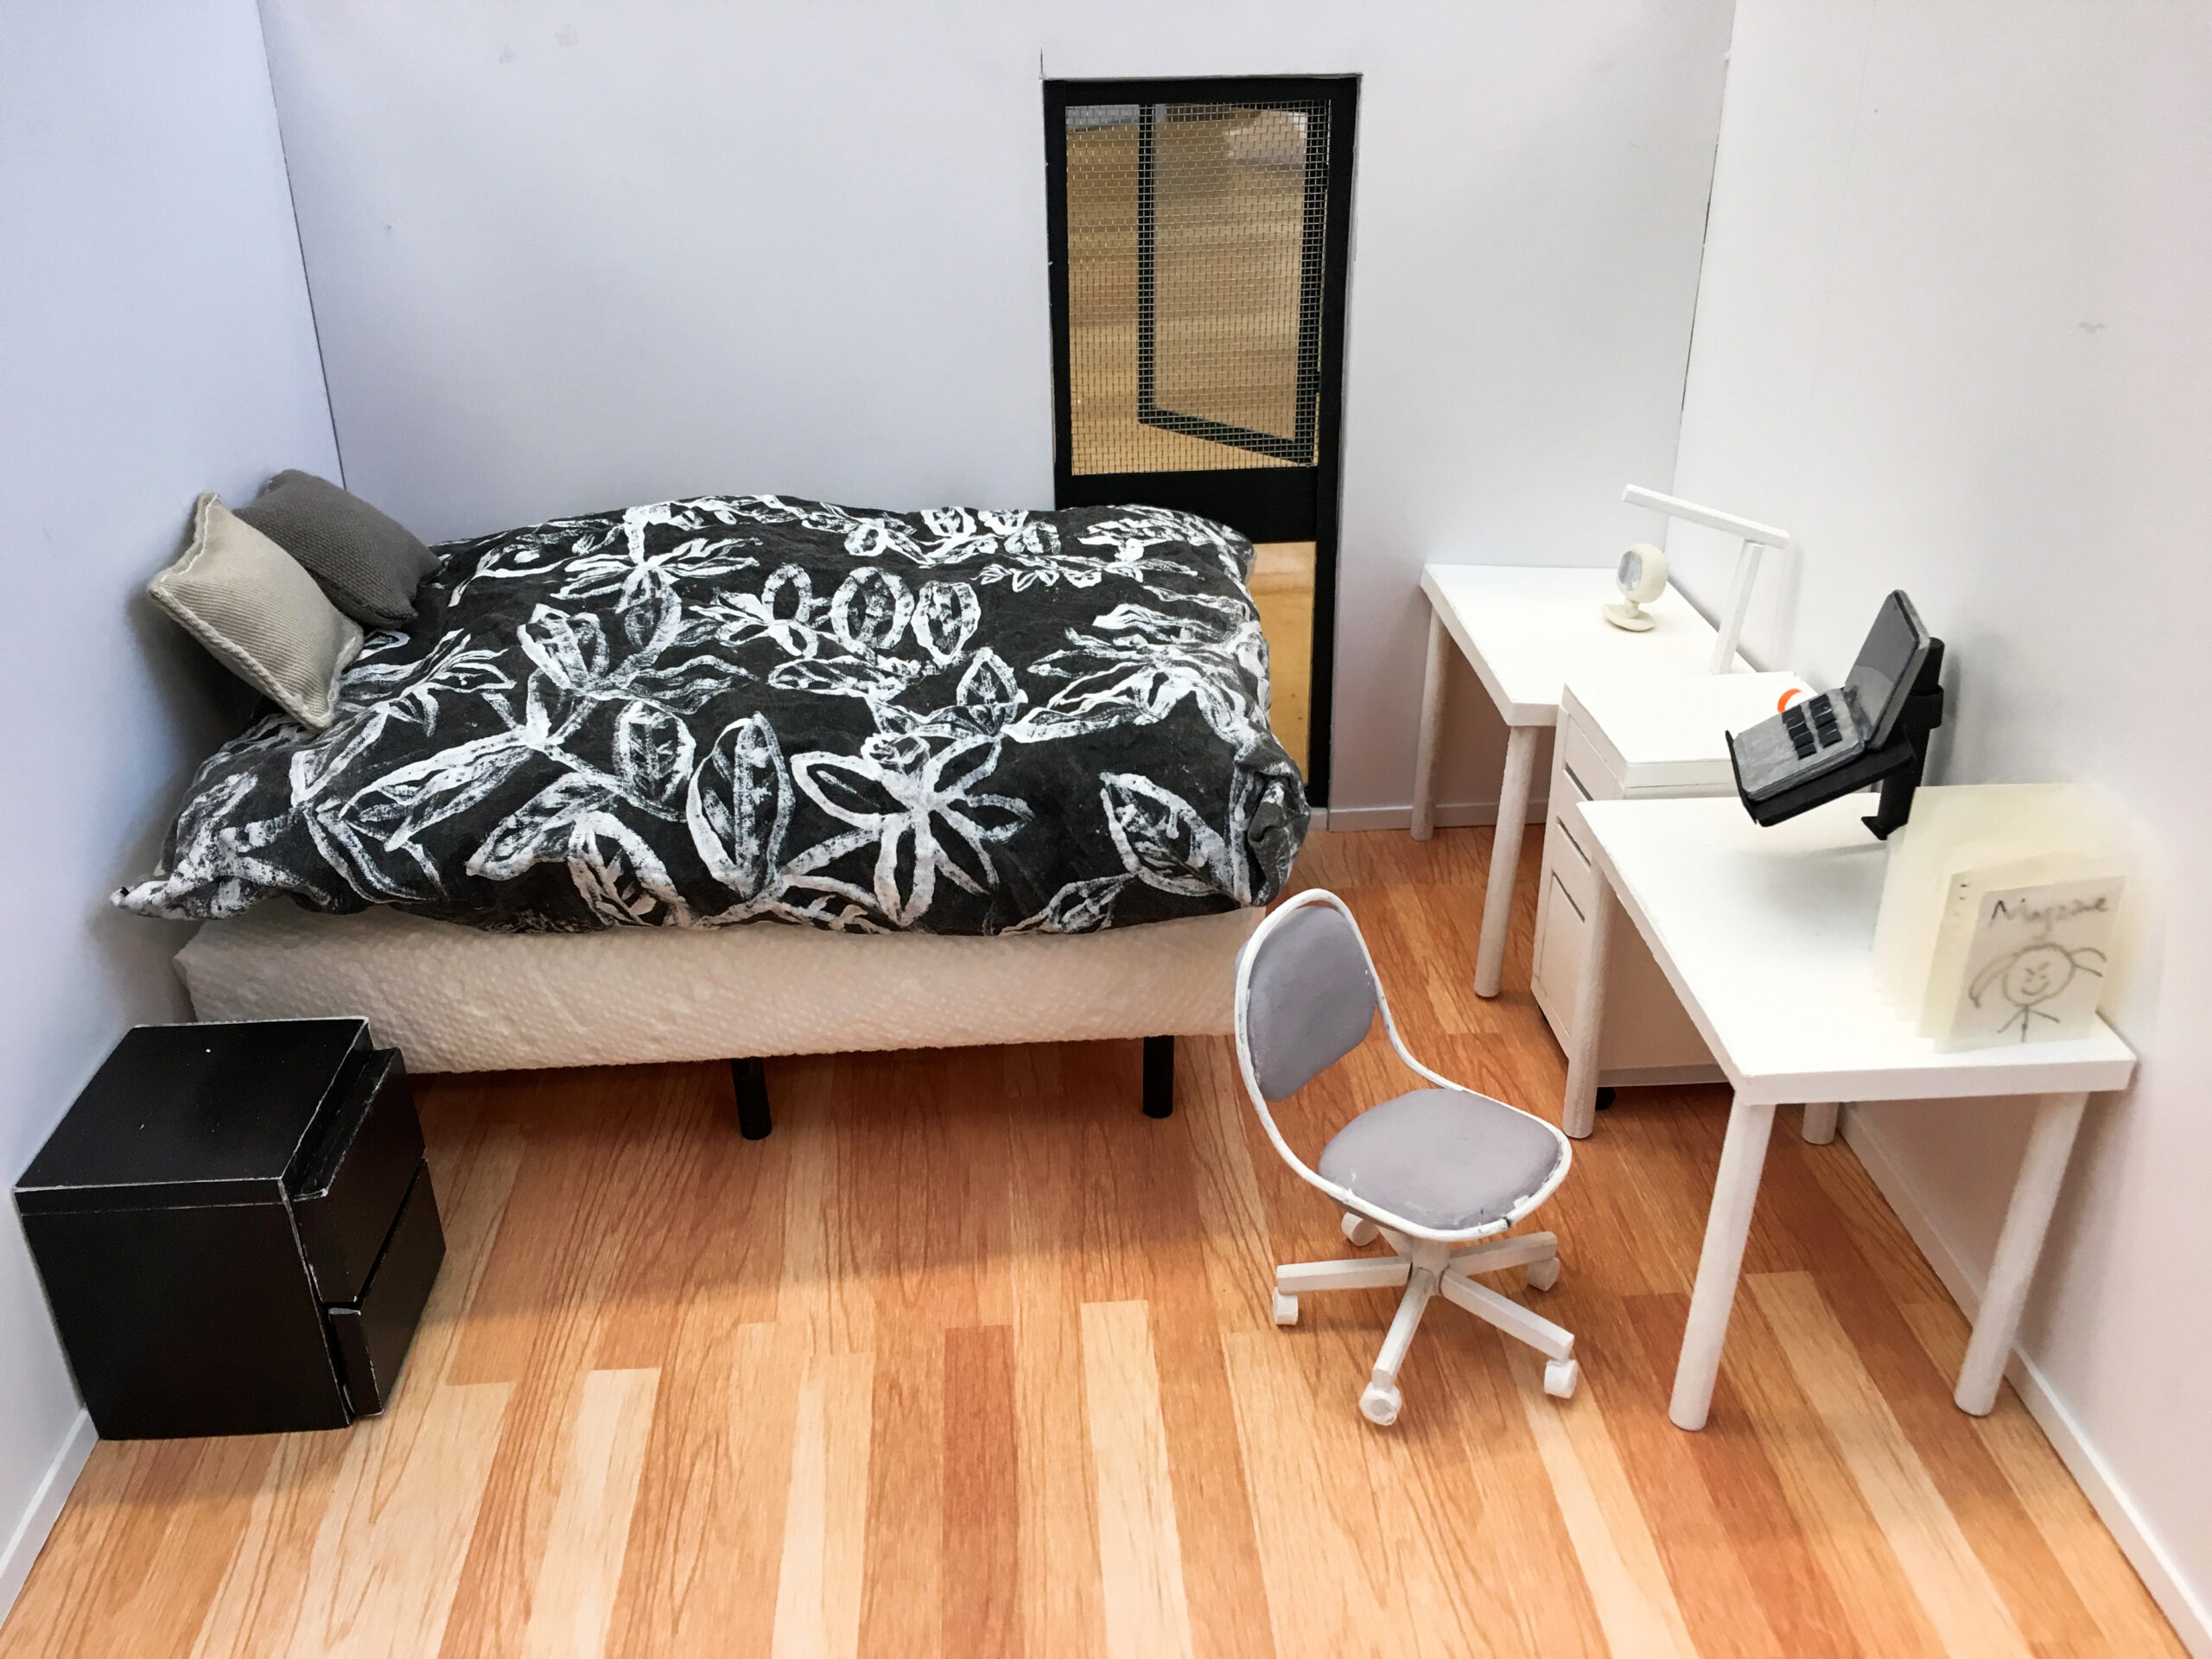
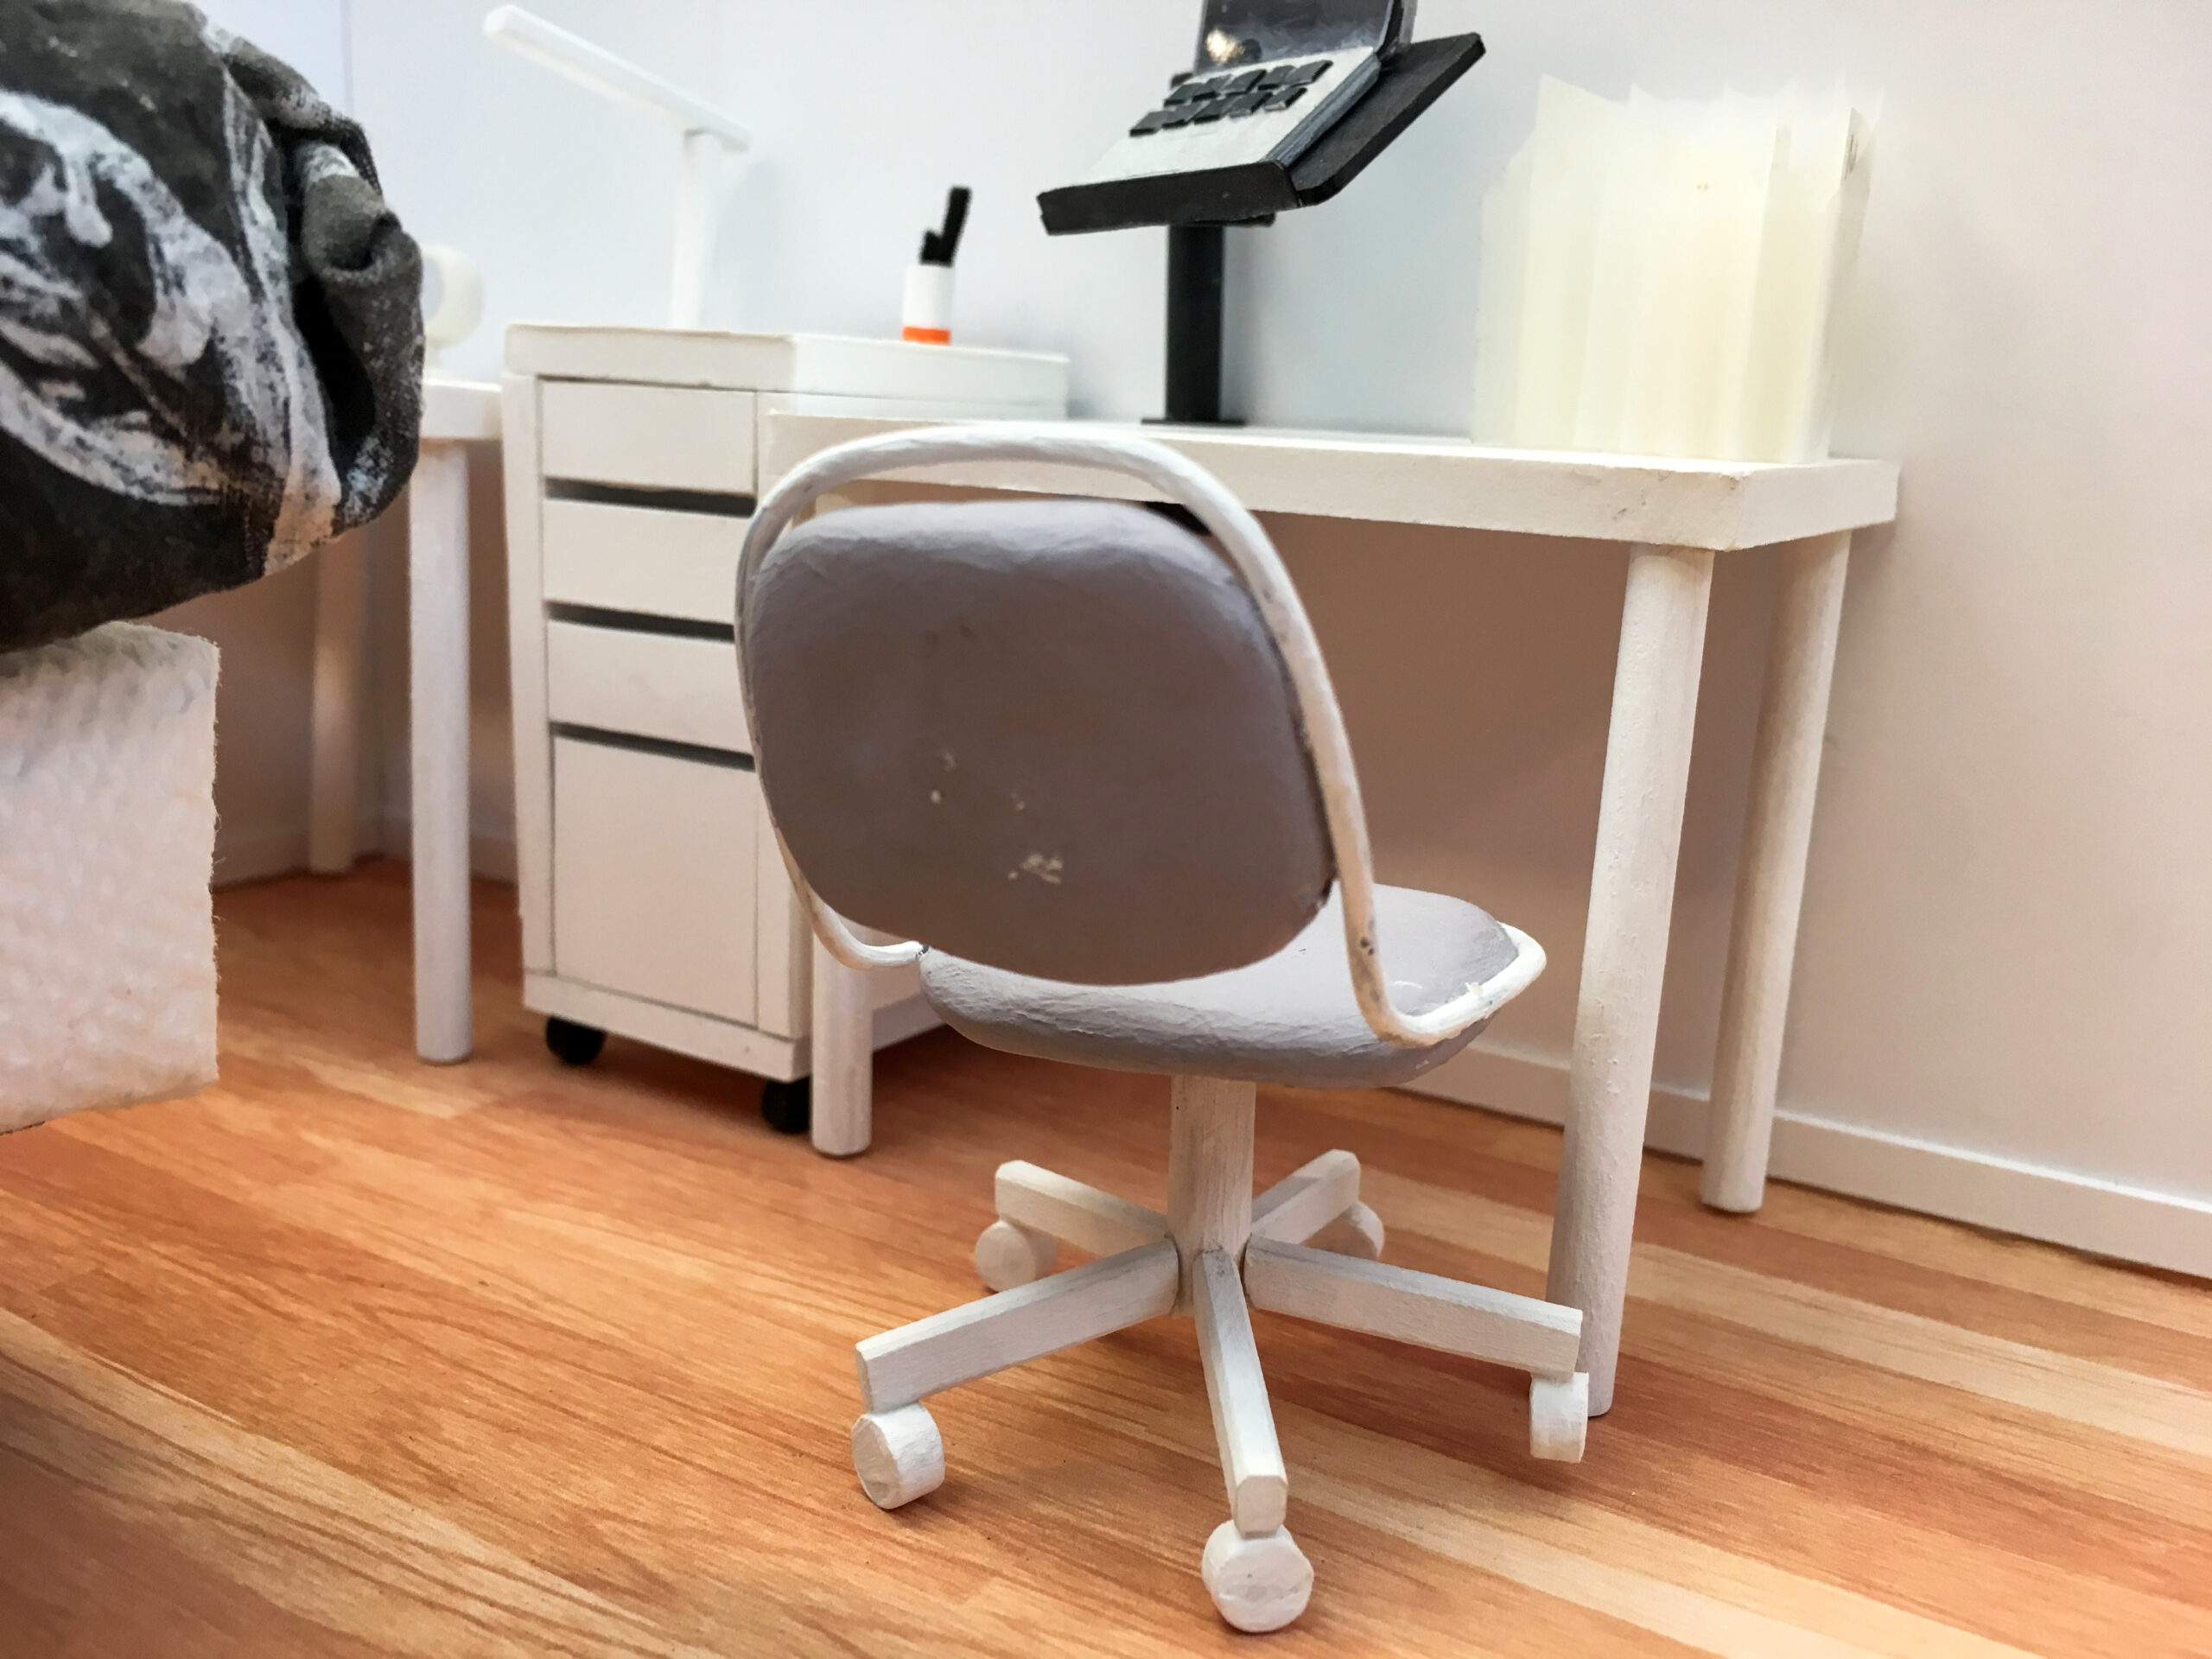
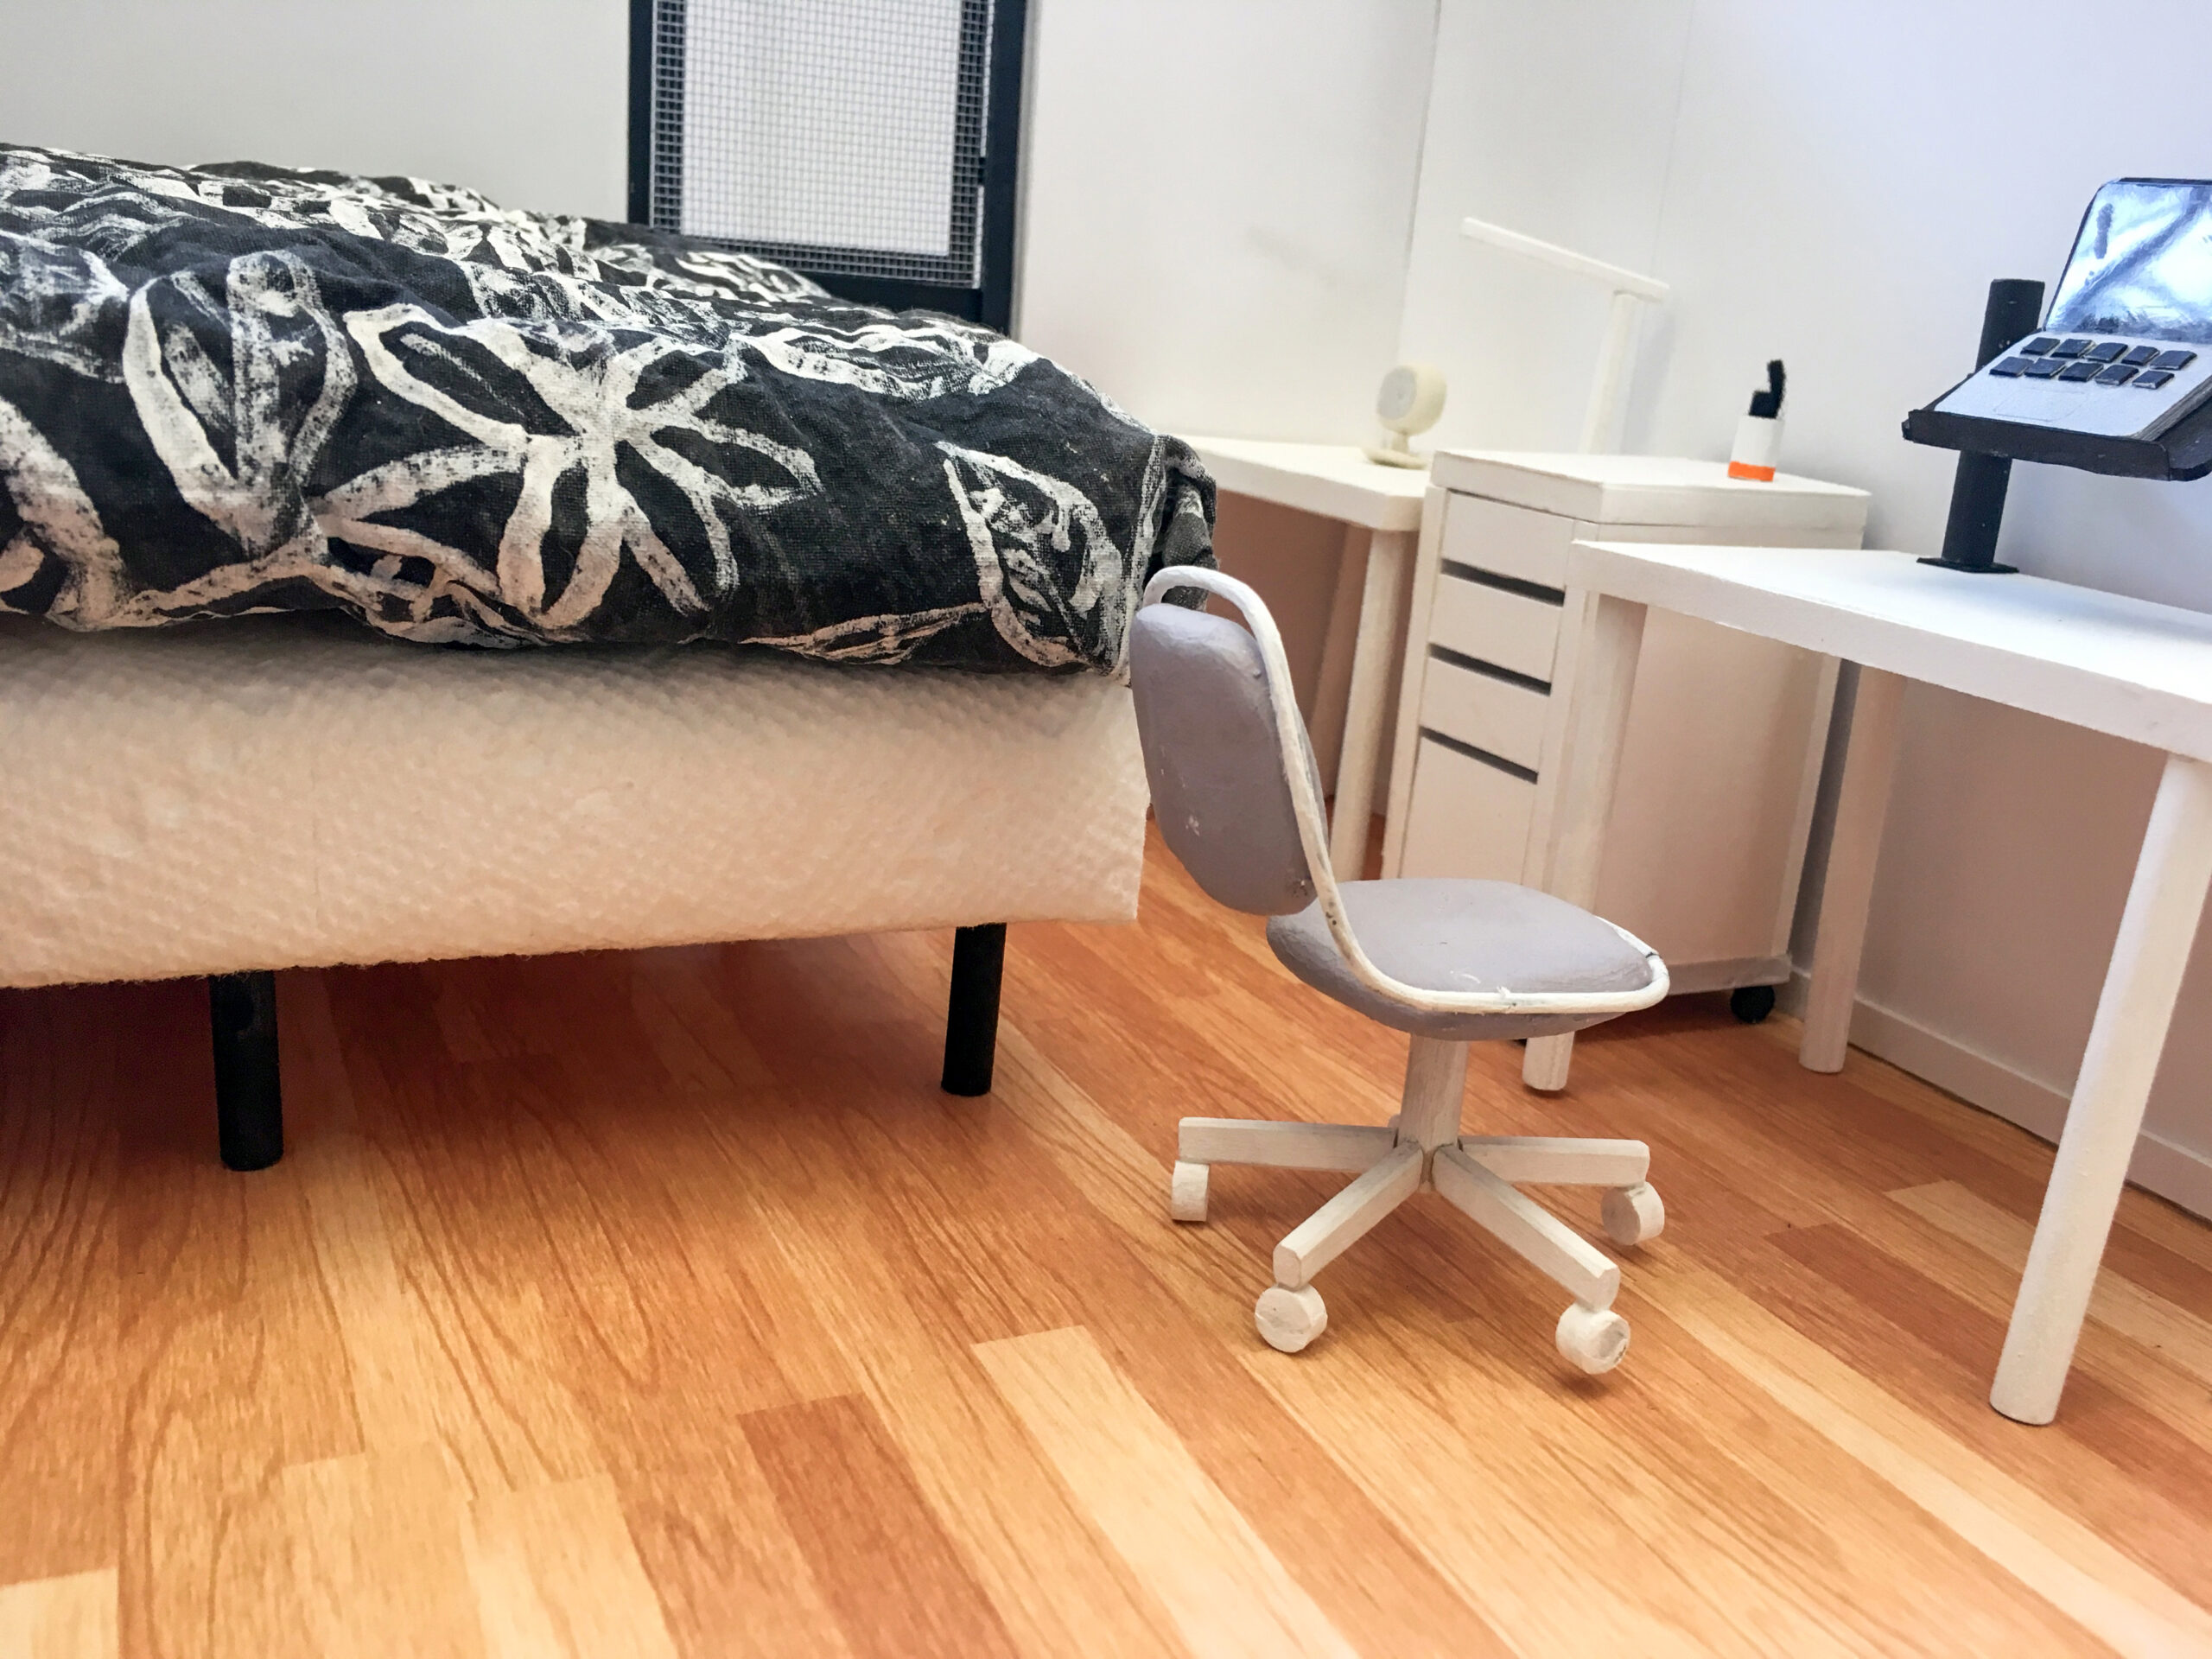
I moved to San Francisco in the summer of 2017. I was looking forward to the next three years living there. To memorize the turning point in my life, I built a model of my new home with a scale of 1:12. The materials included foam core, wood, clay, clothes, tissues, and pigments.

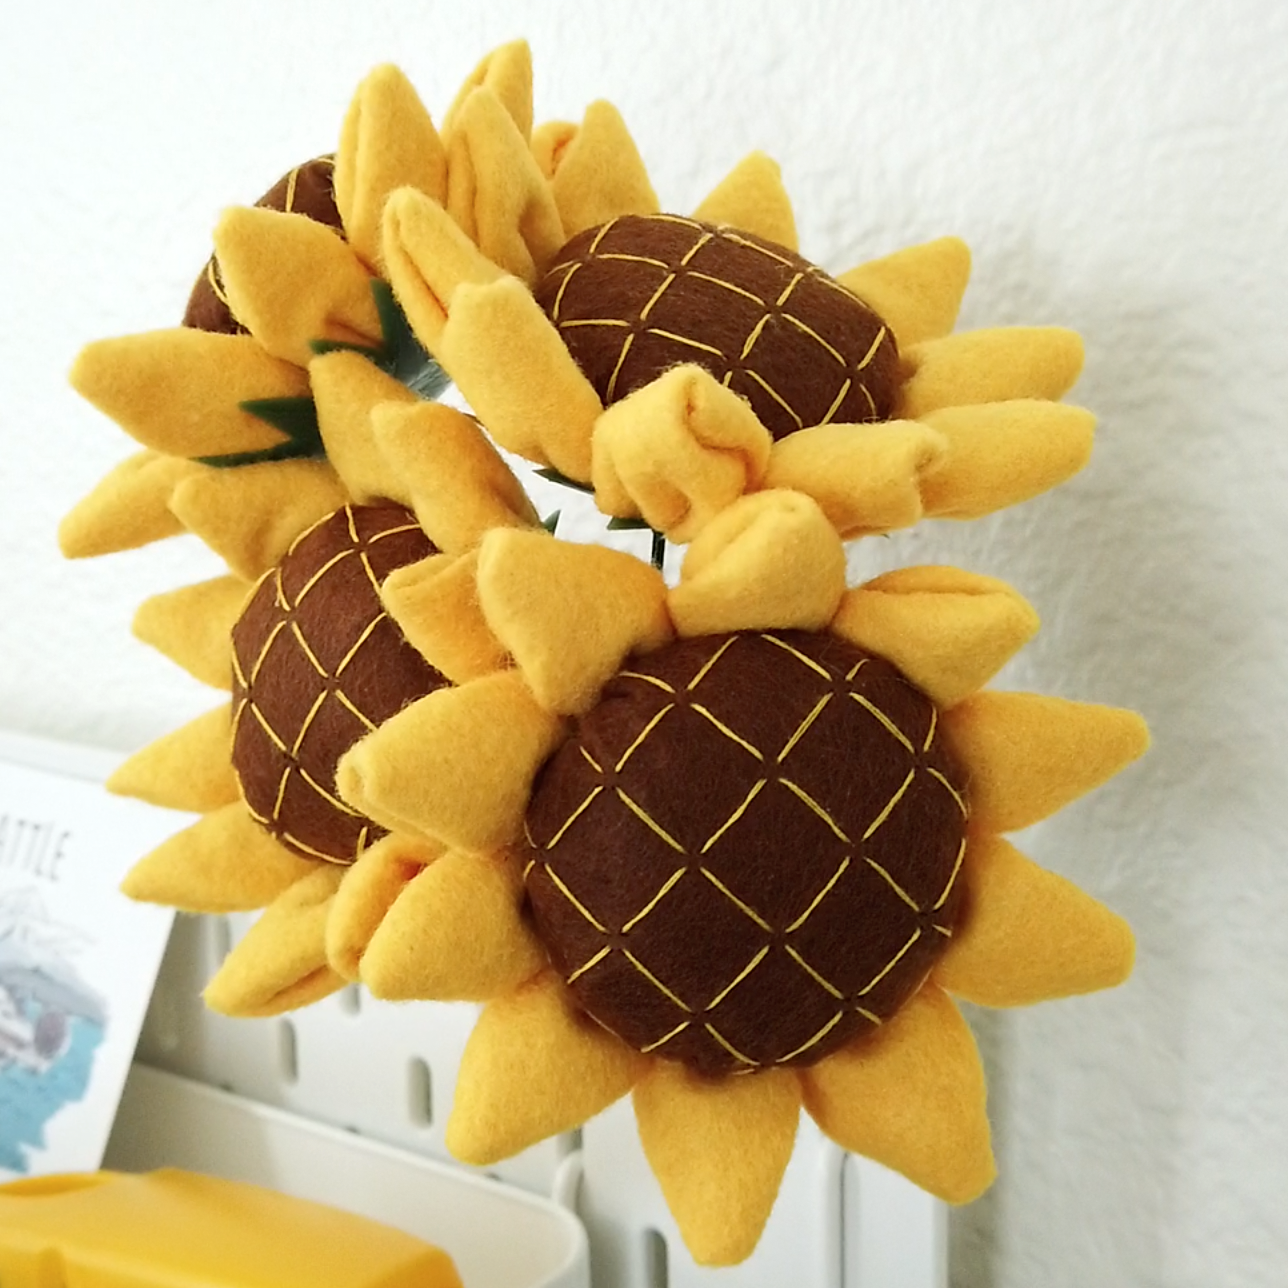
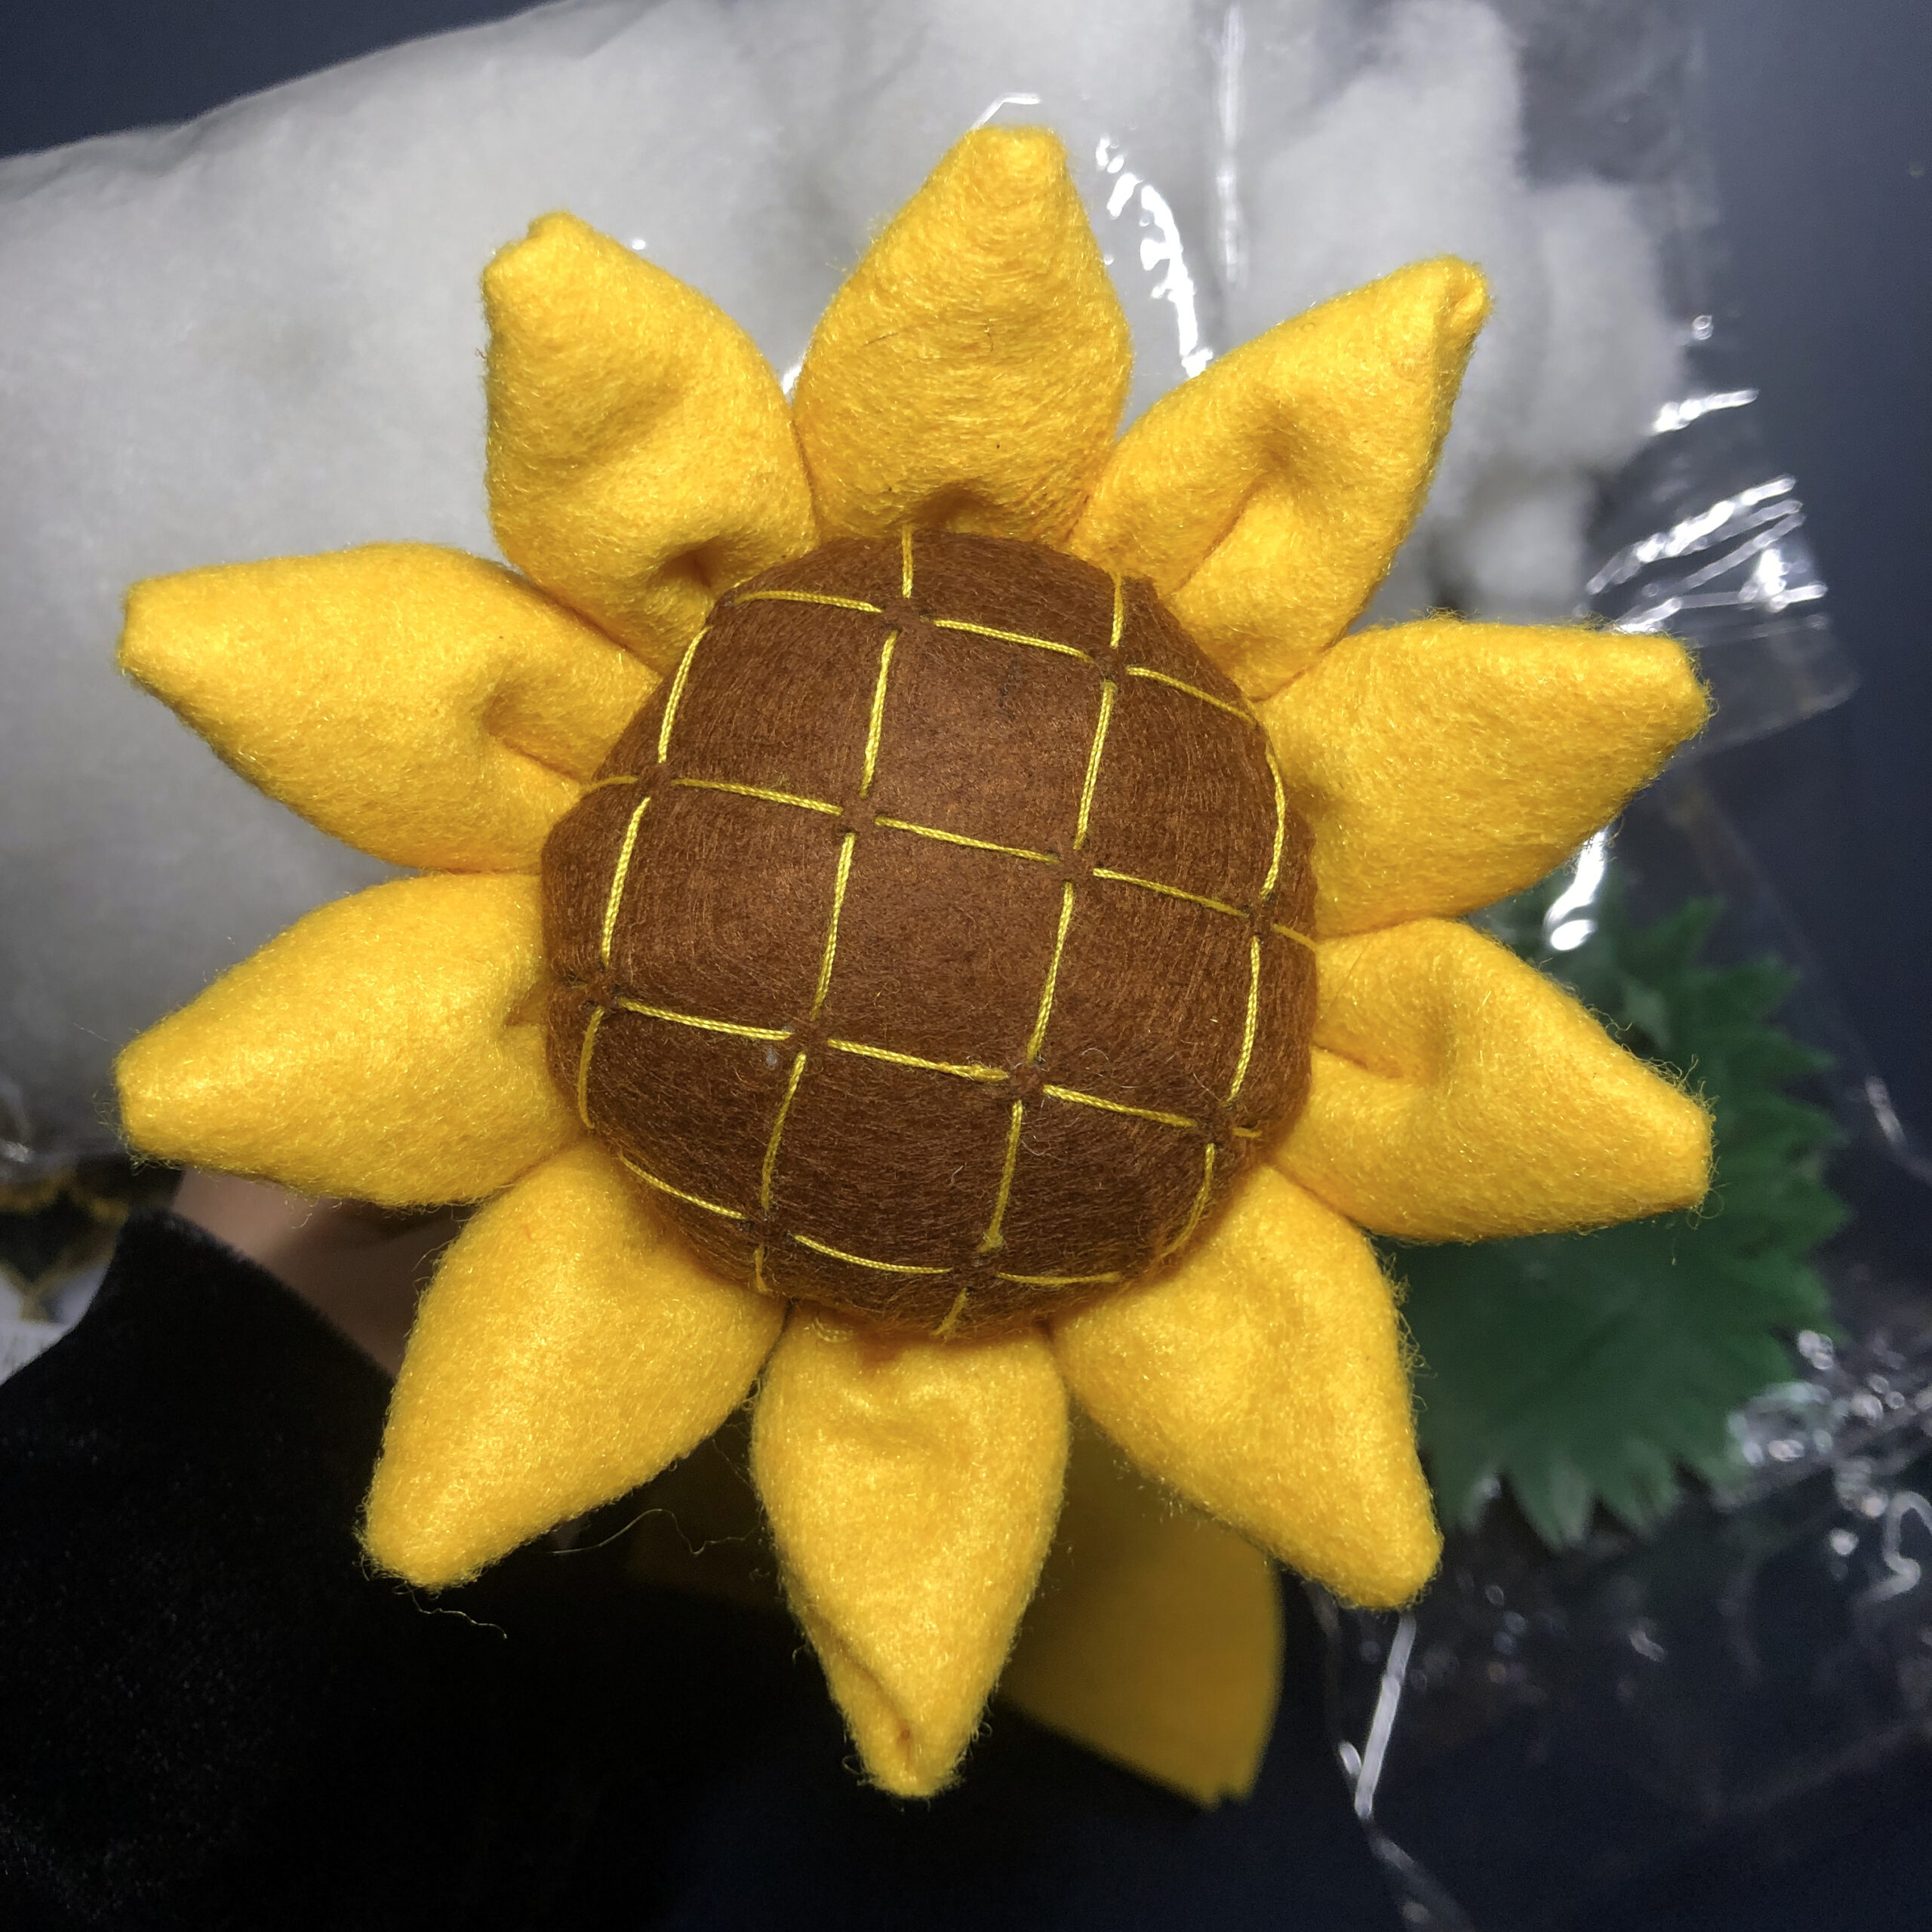
STITICHING
Handcrafting
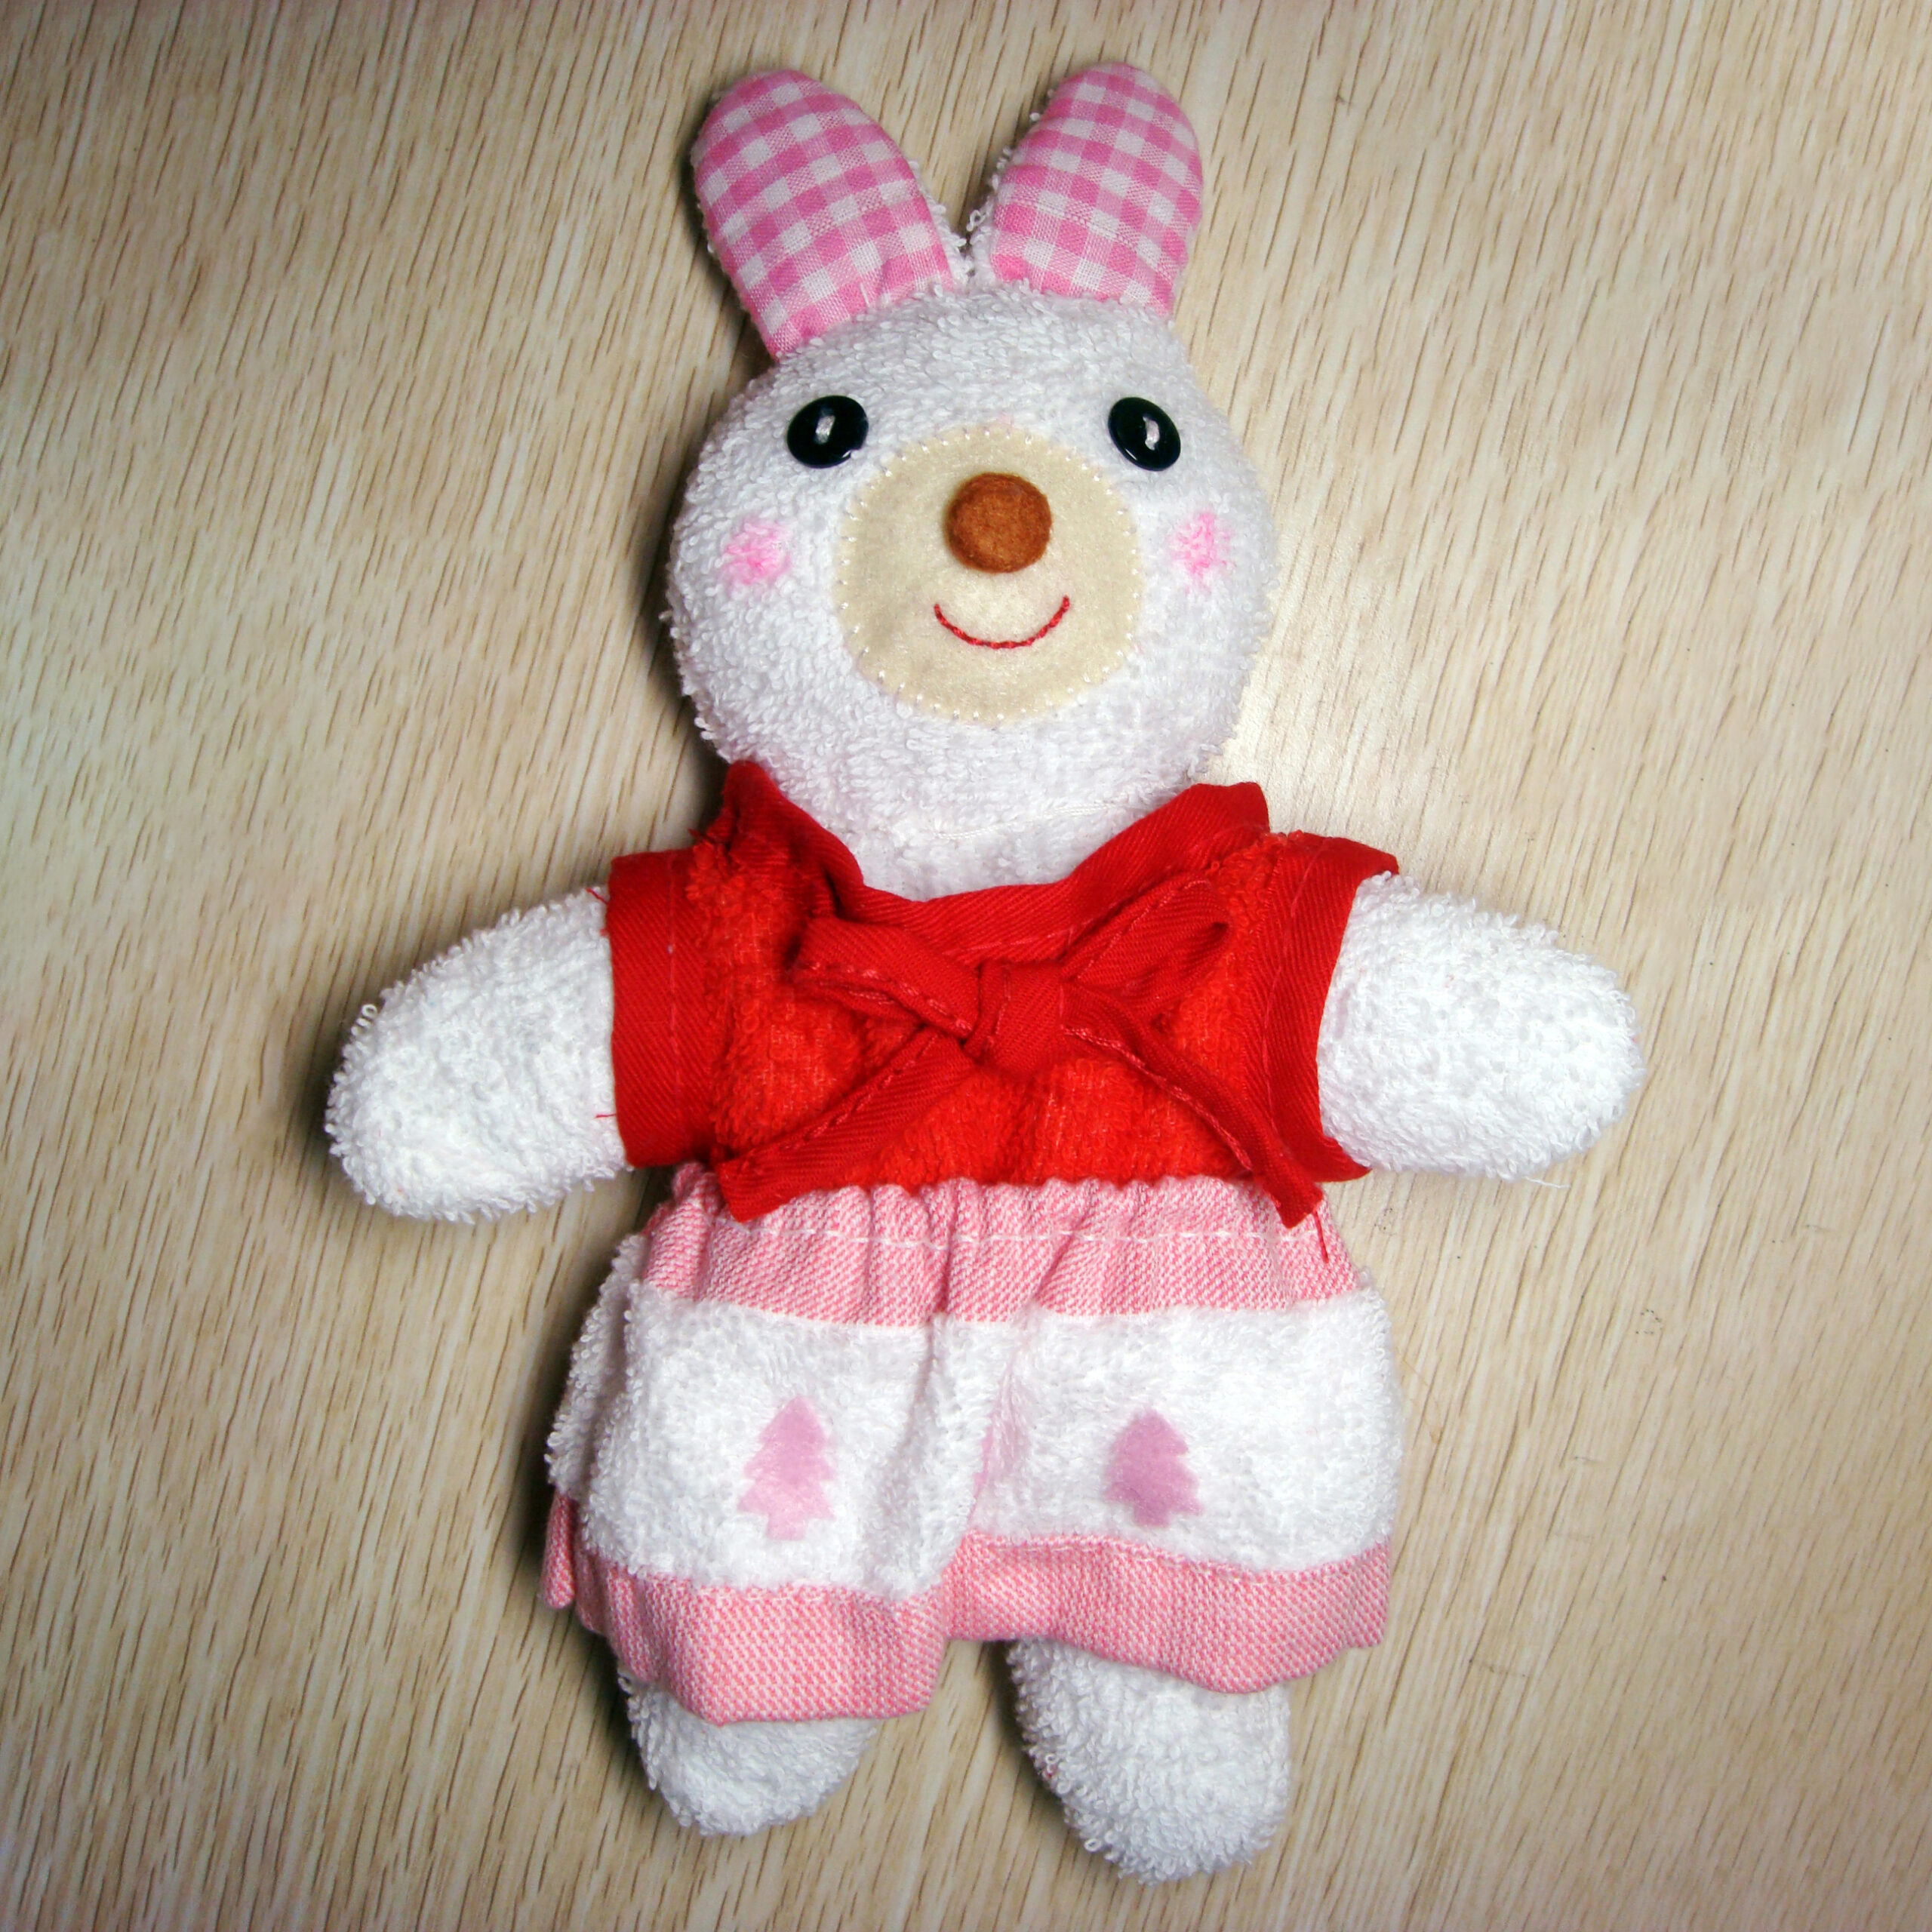
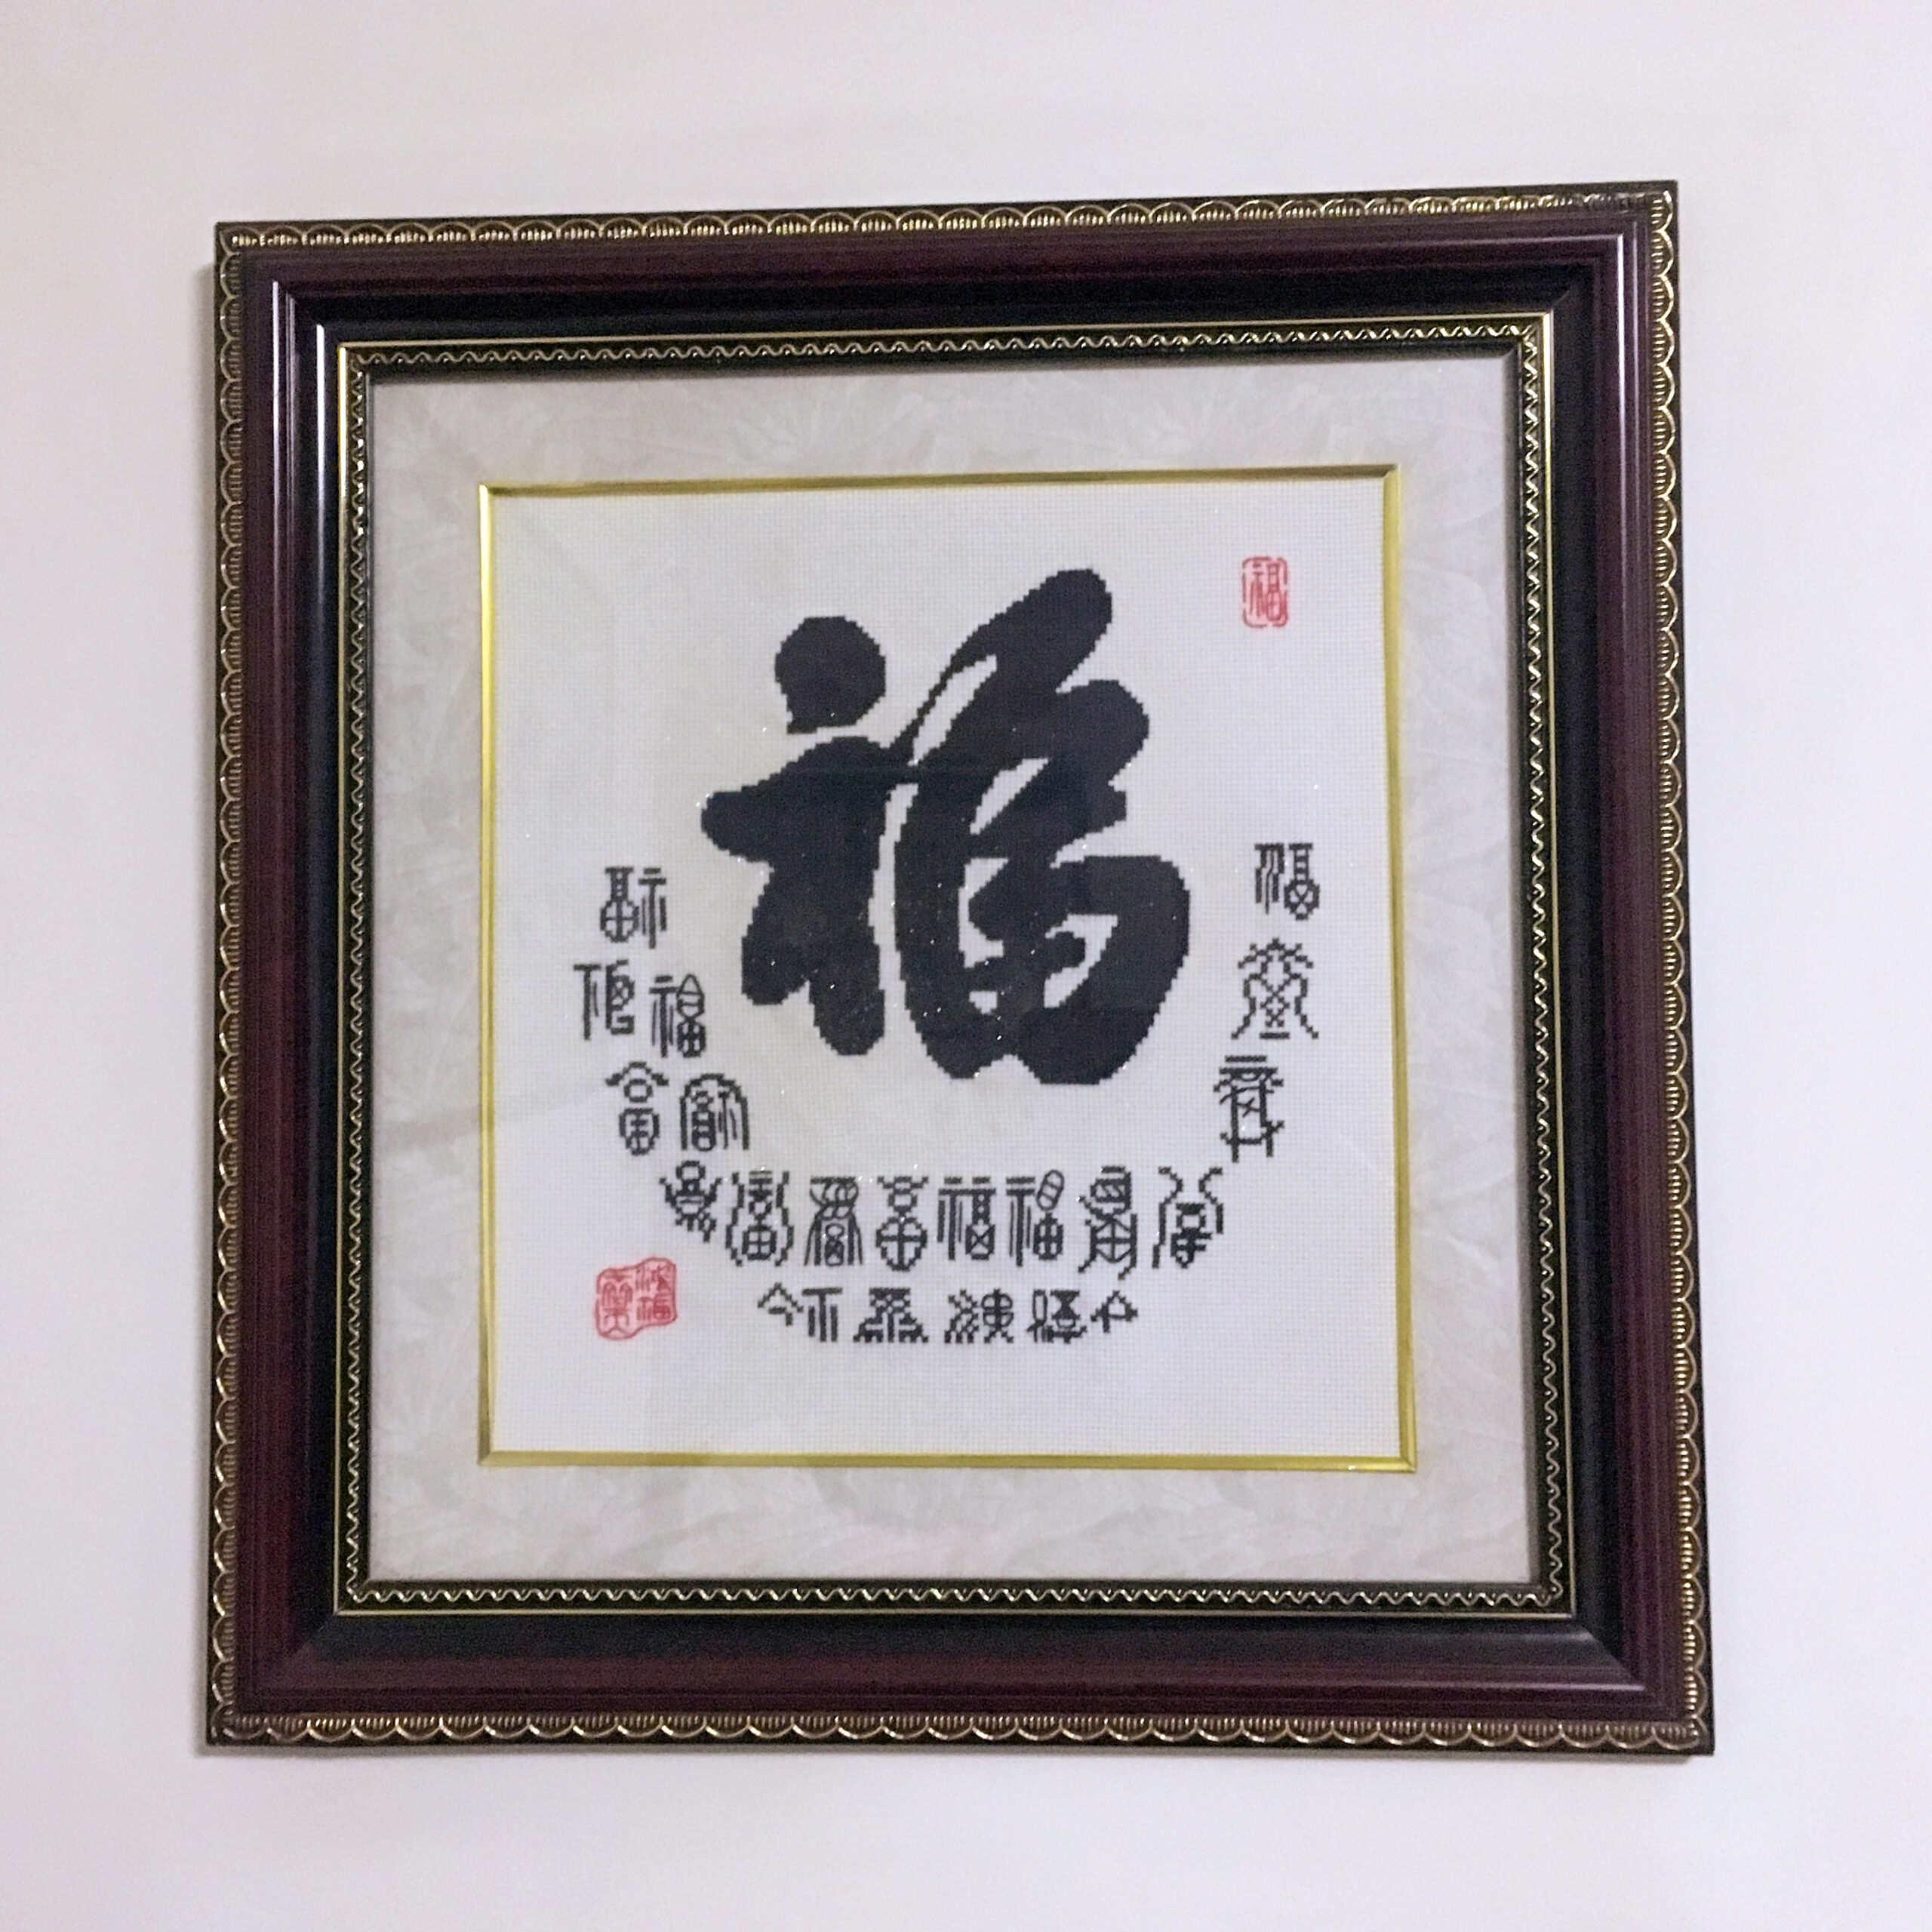
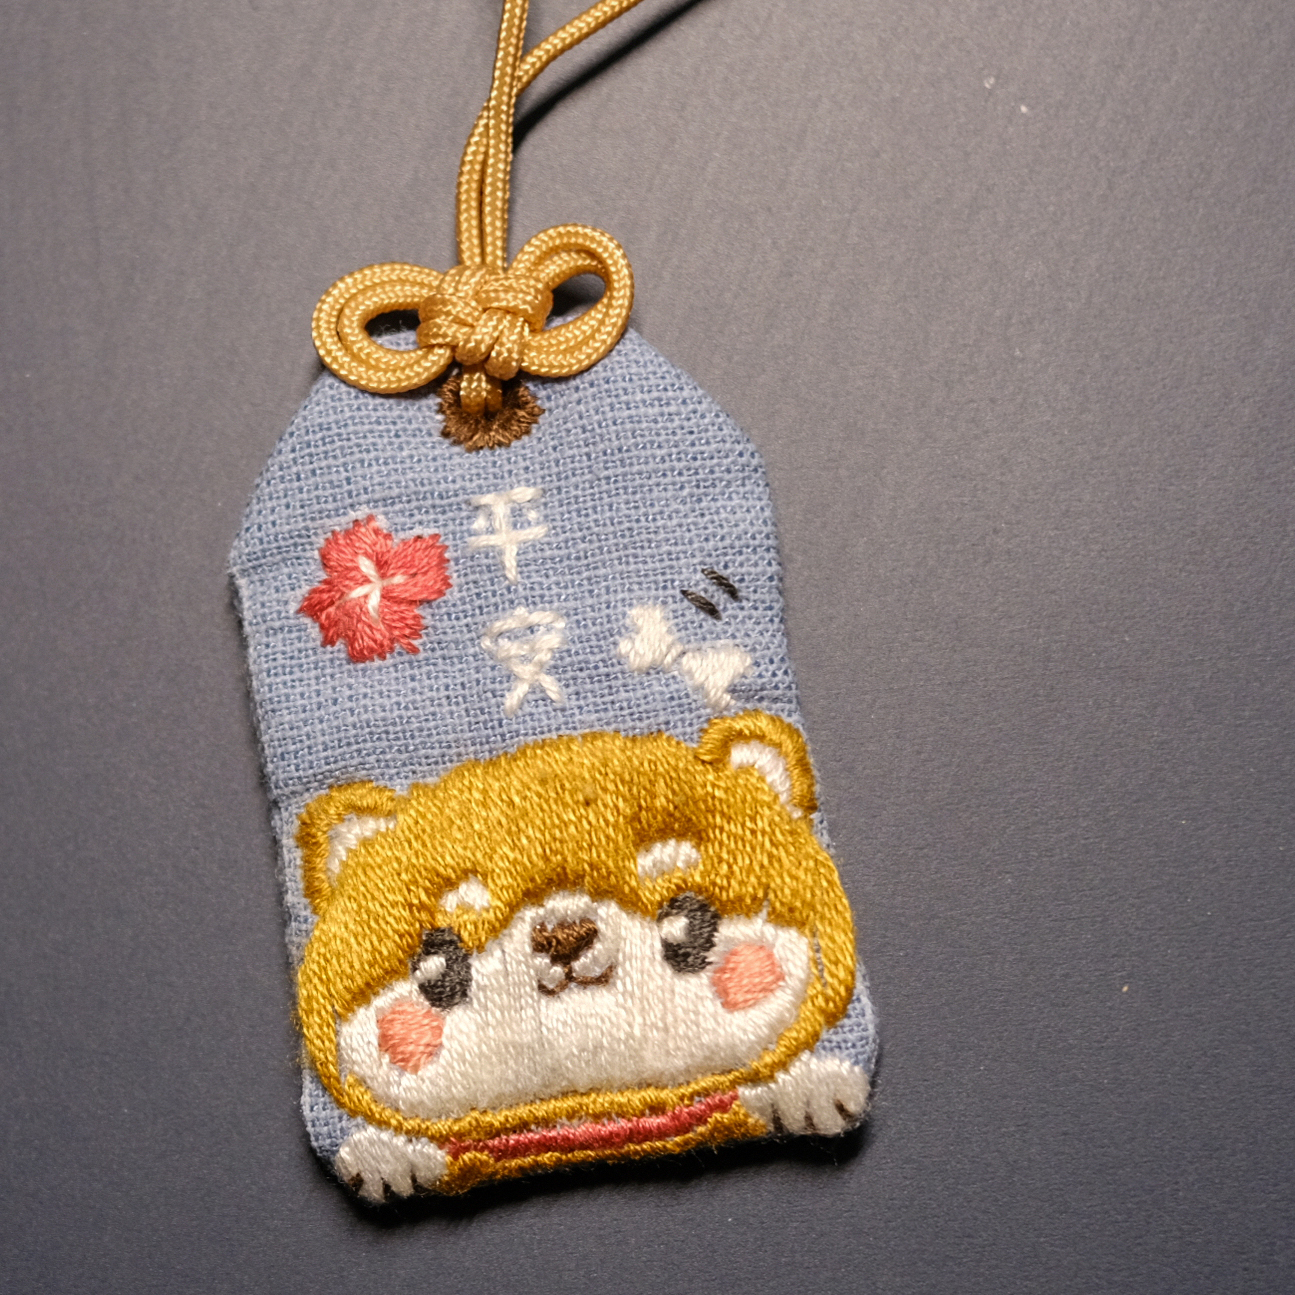
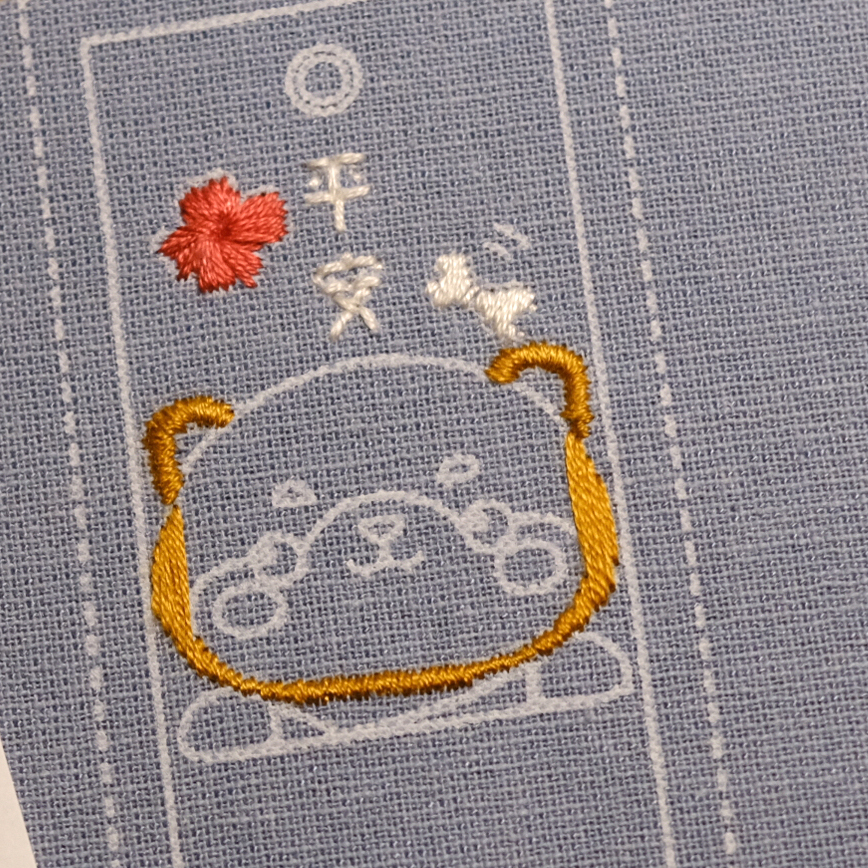
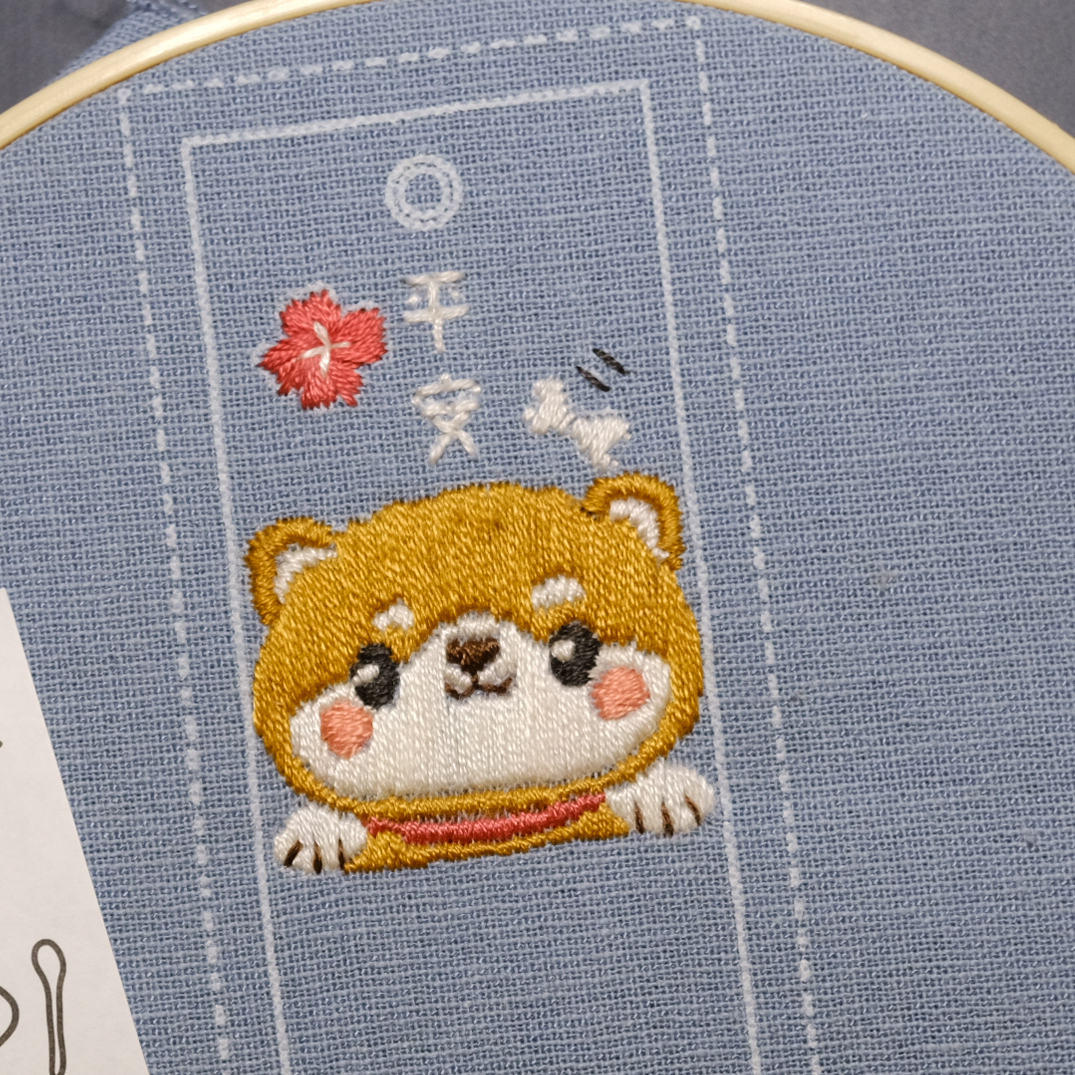
I made clothes for my dolls since I was a child. When I grow up, I have tried other stitching, like felt stitching, cross-stitching, and sewing. The bunny is made of towels and filled with cotton. Her clothes are removable.

© 2024 Zhu with 🍉
Contact
zhz.1208@gmail.com
